
An Indeterminate Future
Dear Readers,

With BTC currently in a holding pattern, not far off the highs, I thought I’d write something a bit more conceptual this time round [though with some practical TA mixed in]. Something I’ve found always of interest is the idea of an indeterminate future combined with the fact that, habitually, most of us investors tend to presuppose a determinate or linear future. This no doubt is due to the fact that Newton still casts a long shadow over us despite living in the more indeterminate universe of Einstein. I mean, stop to consider how many Bitcoin investors will exhaust themselves in their desire [or demand] to know which way the price of Bitcoin will go in the future…. and hence that most naive of questions directed at the chart - “so you’ve described what price has done, know tell me what it will do?” Add to this that you’ve then got the equally naive but opposite statement of - “so you’ve shown me a long-term model of Bitcoin, but they’re only squiggly lines on a chart, there is nothing that necessitates that this should happen”. Though this later statement is seemingly motivated by randomness [the antithetical twin of certainty], it is more likely motivated by a desire to see much more fantastical prices to the upside. The question must strike the reader as to how these various outlooks are to be resolved - how can an indeterminate view of the future be reconciled with a belief in a model that provides, if not astronomical prices, stratospheric ones in the future.
Indeterminacy
Where indeterminacy allows for multiple outcomes, itself based on the idea of choice and freedom that we have as agents, determinacy has a linear outlook on the world. Cause and effect is its mantra, the system is a closed one, and there must be a singular outcome. It is persuasive, but more than that it just functions in the general background for many that never bother to think it through [who has the time to in our busy, organized and specialized economies?] It is simply the default option, and naturally we want to know the future, which from the rational perspective is obviously unknowable. Of course, a form of reason, that of theory, might insist on determinacy, but this is to miss the point. Theoretically, both determinacy and indeterminacy can be argued, but practically, the world is indeterminate. As individuals we make our choices as best we can, and so too as investors, we function as if the world is indeterminate. For all intensive purposes, as investors, we must accept indeterminacy.
The Recognition of Indeterminacy
With this re-cognition, comes the beginning of a balancing out of various options/ futures. One may gain exposure to a particular outcome while at the same time avoiding overexposure if it failed to eventuate [notice the capacity to think more than one outcome]. There is here a midway point between two poles; that of certainty on the one hand, and randomness on the other. Both of these poles can tend to get the better of us, where we can capitulate to either the position of the certain fundamentalist [the dogmatic assertion of an eventual outcome], or to the randomness of the gambler who throws all caution to the air. But what exactly is this midway point between determinacy and randomness you might ask. It is hypothesis, a form of rationality toward the future that always has an inbuilt hedge. It is a form of theory that is provisional and empirical, but never dogmatic. It is also a form of speculation. It is interesting that the word speculation refers to not only mental activity but also financial activity. It has a double-faced aspect [like the Roman god of Janus] and no doubt each sphere might contribute considerably to the other - financial speculation enabling the leisure for intellectual speculation, and intellectual speculation enabling a more effective financial speculation. But to bring this back to hypothesis.
Hypothesis of the Technicals
As mentioned, a hypothesis provides some rational basis on which to proceed in both the world of theoretical speculation and the world of practical investment. Given we’ve looked at the first, time now to look at the more practical second, and in particular how it relates to our Bitcoin investment. Both technical analysis and modeling presuppose hypothesis.
When drawing a line of support or resistance on a technical chart, we mean to say that price is behaving as if it were observing that line. There is no question of price action actually being dictated to, or determined, by that line. This then brings into play degrees of probability [think of probability lying on a spectrum]. As mentioned in an earlier article, the time-frame involved relates to the degree of probability:
If time were to be placed on a spectrum, with the shortest of periods at one end and the longest of periods at the other, randomness and possibility would belong to the shortest periods, while pattern and probability would belong to the longest periods. There would be varying degrees of probability/ randomness depending on what point of the spectrum you were dealing with - at the one end, minutes would be near completely random, at the other end, years would have a much higher degree of probability. Just as with any science, where momentary observations only start to make sense when accumulated into a mass over a longer period of time, so too with T.A.
This is why the shorter-term charts can only really be descriptive and not prescriptive/ predictive - those shorter-term trend lines have less probability of holding, with the shortest term price actions being near random. Case in point:
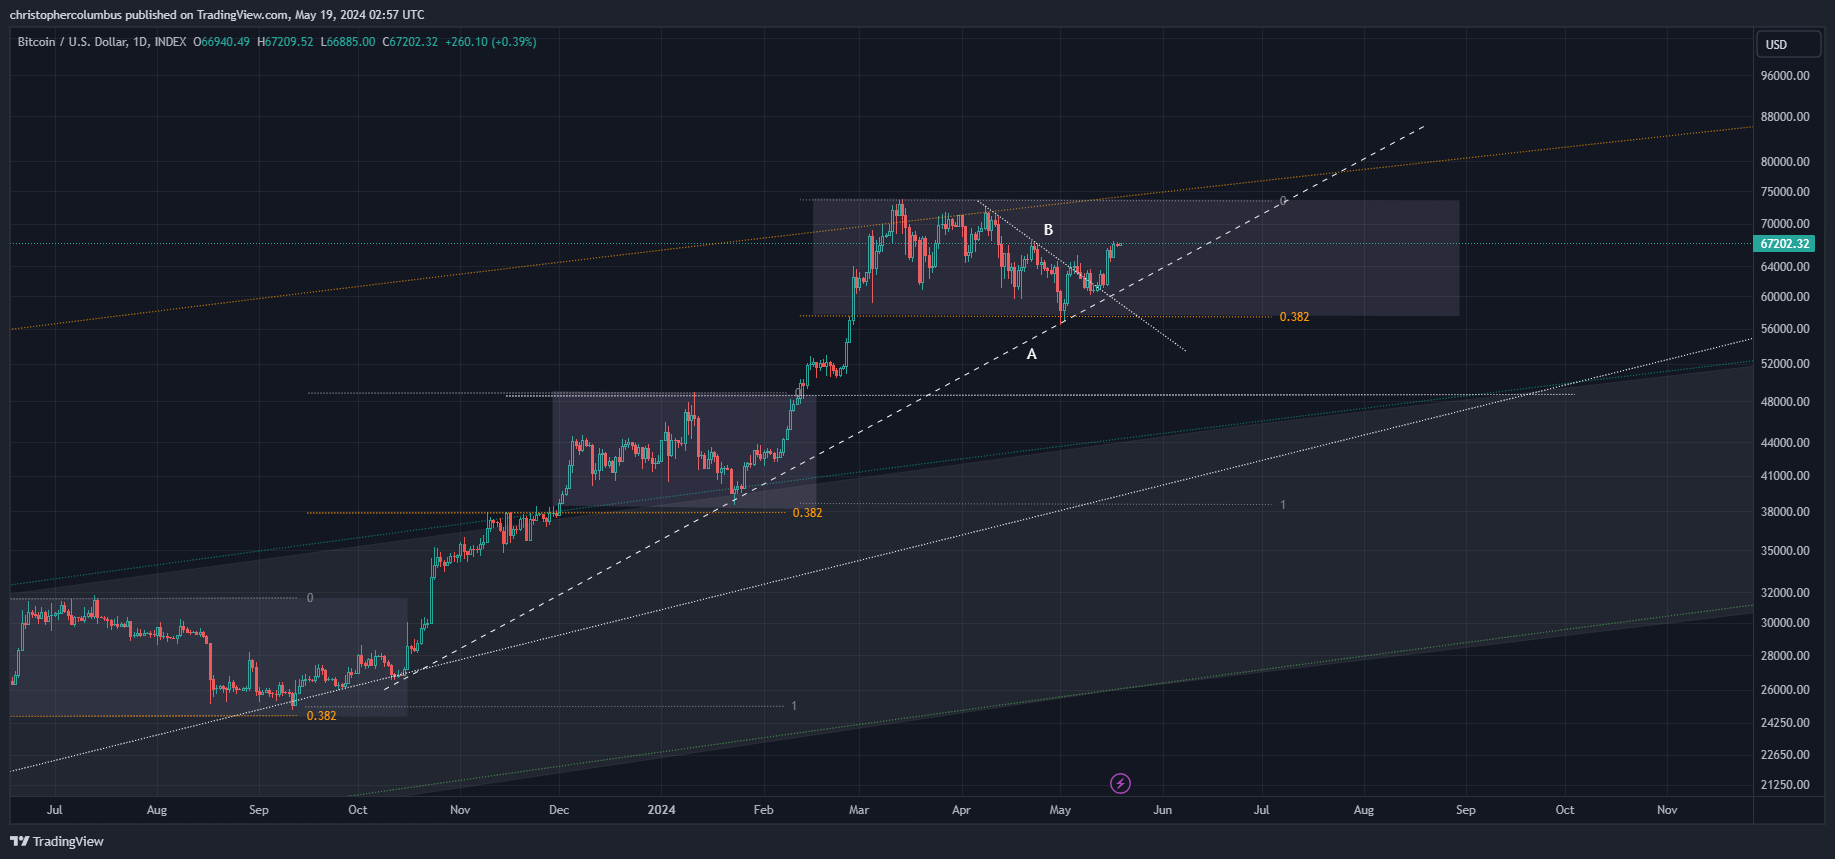
Though this daily chart shows price action over multiple months, it could also be considered a relatively shorter-term chart. A is the longer term line of support, and B is the shorter term line of resistance. It is quite remarkable that so far A has acted as if it were support, and trumped the shorter-term line of resistance. Of course, given the logic outlined above, where the pattern on the greater timespan is more probable to play out [though never certain] than the pattern on the shorter timespan, this was to a certain extent to be expected. The probability of this line of support continuing to hold is also greater than the forming horizontal range holding… as it’s on a greater timespan. Of course at some point that upward line of support itself is expected to be broken to the downside by an even greater pattern formed on the weekly and monthly charts. On the longest time frame, this takes us from the hypothesis of TA to the hypothesis of the model.

On the face of it, and with the line of support continuing to hold, there is a good chance of the fib pattern repeating yet again… on a break of the local high [if looking to buy, why not wait for that break? Alternatively, one could consider the more volatile alts]. Now if price were to repeat the pattern, that would take price well beyond previous highs [through 110K], and this in itself may serve to turn what is here an essentially technical market into a more manic and parabolic one. The line I’ve sketched higher in the LGC channel is at the 150K level, which brings me to the highest timeframe of the LGC channel.
Hypothesis of the Model
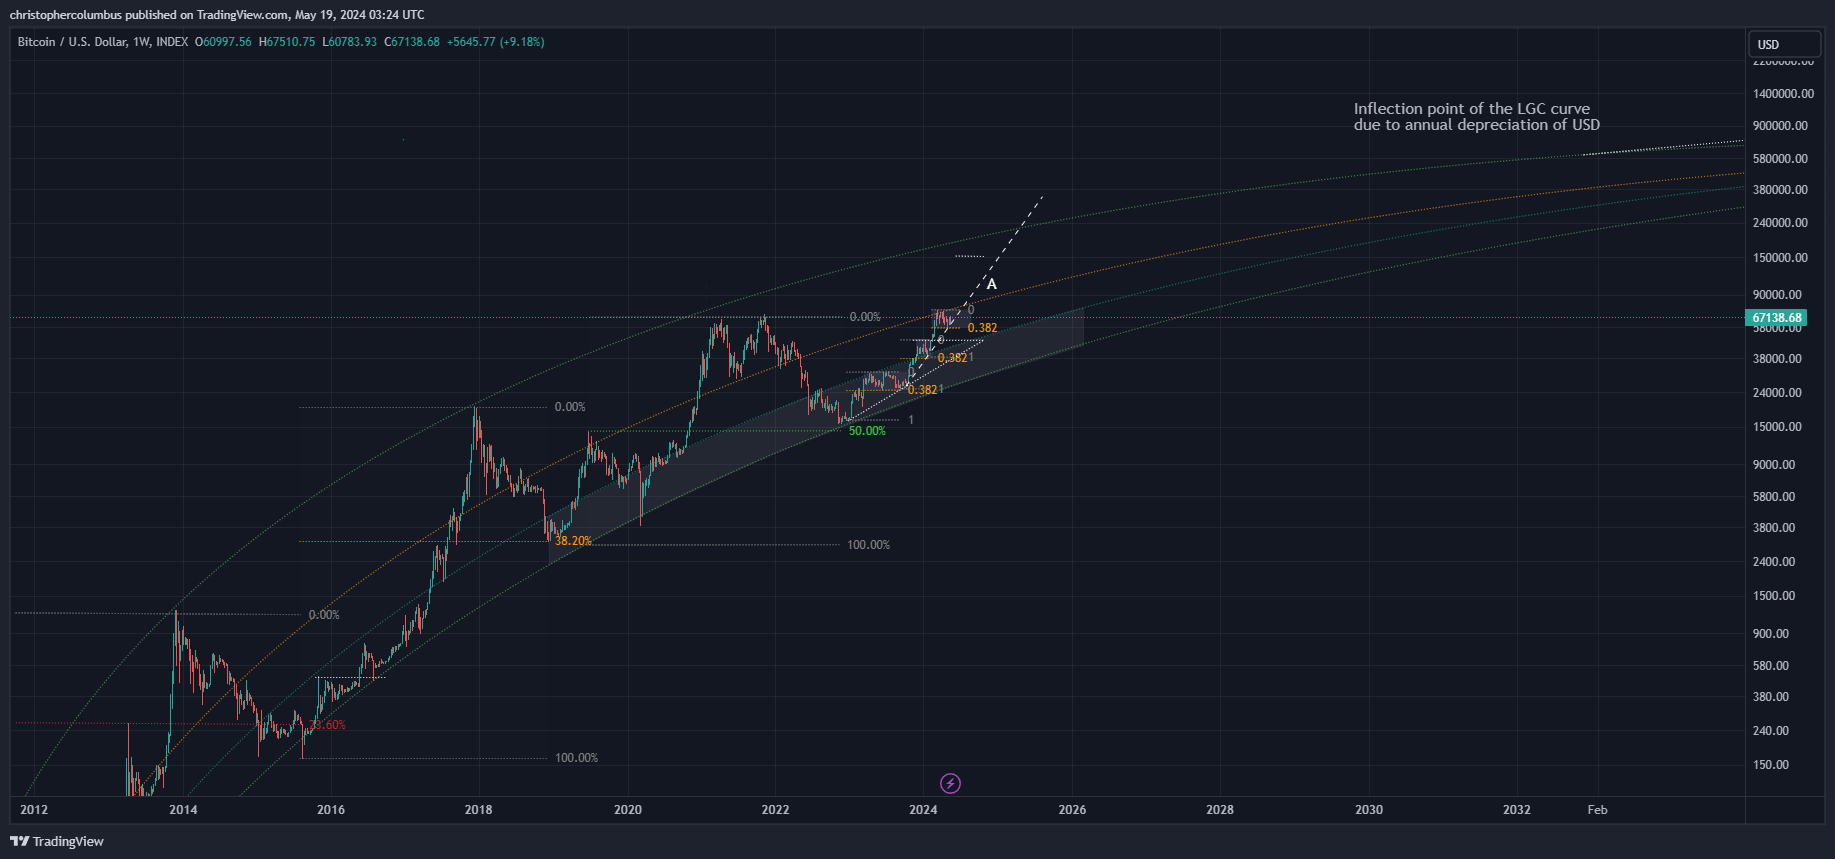
As you can see, on the largest timeframe the hypothesis of a logarithmic growth curve developing in price, as the nascent currency of Bitcoin is further capitalized, has the LGC trend containing at some point that steep technical line [A]. Why is it that it is considered more likely to contain a manic market than that mania continuing to push price to the upside? Because of the timeframe in which the hypothesis has been held and severely tested. The more crucial tests it has survived, where each time it could have potentially beeen invalidated, the stronger the hypothesis/ theory is. As you can see, the LGC channel has contained price to both the bottom and the top since 2018 [since first projected].

In summary, given that the current upward trend and line of support is holding on the medium term, it’s reasonable to expect to see it continue to hold. Perhaps this could be phrased differently - the default position is one of probability for further price action to the upside as opposed to probability of further consolidation. Of course, further consolidation is always possible, but there is no reason to weight probability to the downside. The possibility to the downside is instead covered by your overall hedged position that coincides with the fact that hypothesis, a reasonable belief in something on the basis of observed experience, is always hedged due to the fact that the very notion of hypothesis is based on the uncertainty principle. You’ll be exposed, but not overly exposed, which is to be hedged.
Until next time,
Stay, relatively, safe out there,
Dave the Wave.