
BTC into the 2nd Quarter of the 4th Year
Dear Readers,

The Macro
What a difference a cycle or two makes to the expected returns in the BTC market… or not. Where adherents of the 4 year cycle have been expecting similar returns to past cycles, the LGC model has always [since 2018] factored in a substantial diminishing return. This was based both on the LGC [logarithmic growth curve], and the idea of a maturing market. That said, though undiminishing returns has been pretty much consigned to the dustbin of history, the 4 year cycle itself has of yet not.
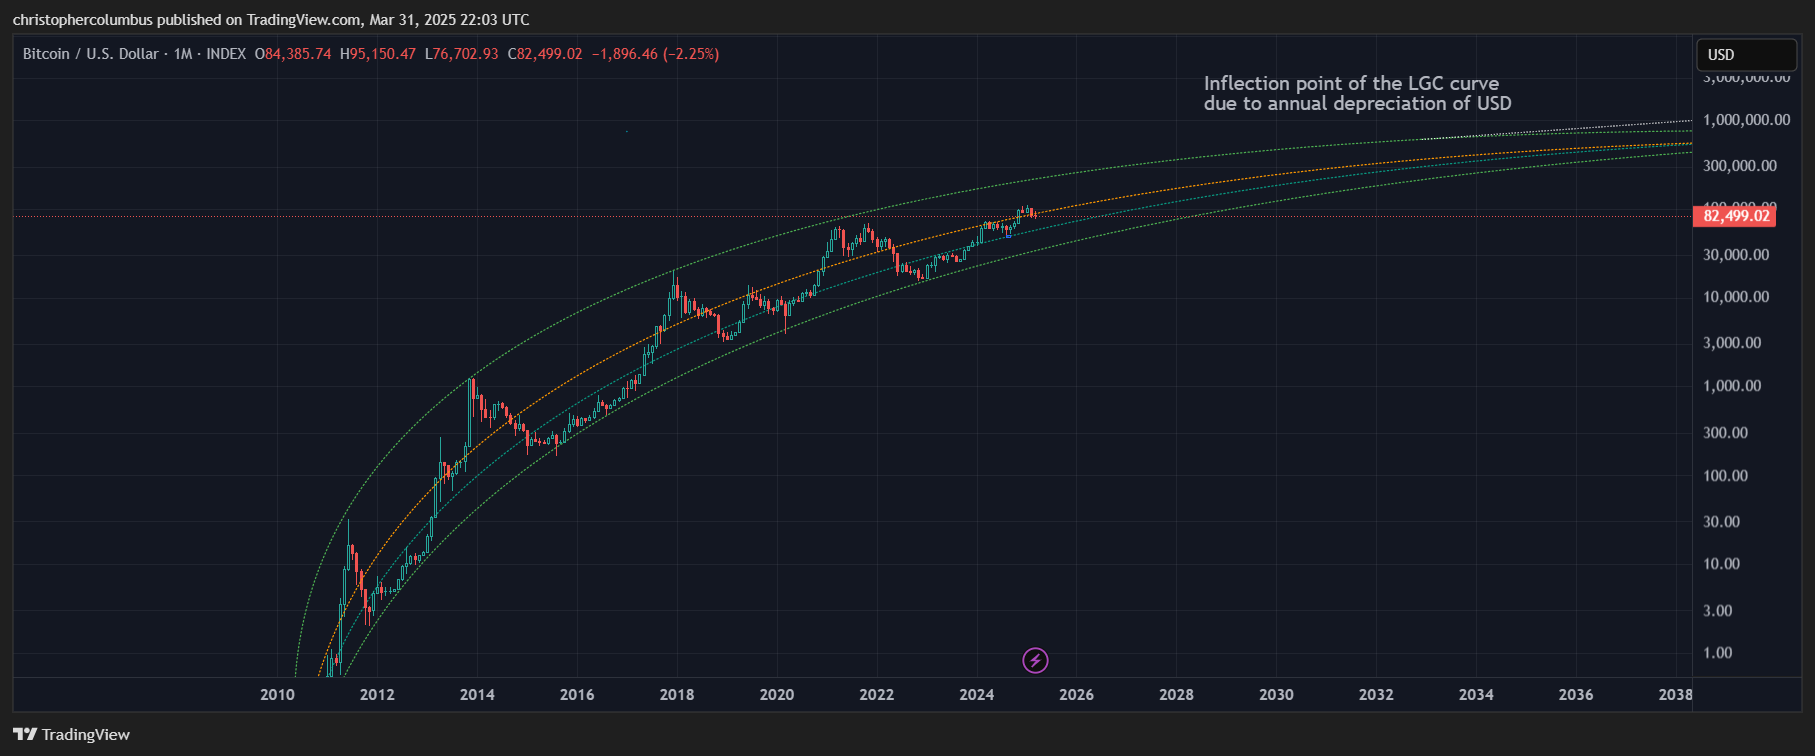
We are currently now in the 2nd quarter of the 4th year, and price is still, in the aggregate, up. What has been markedly different with this cycle is the regular, consistent and technical nature of the move, so far, upward through the channel of the LGC - no basing and eventual slow move to the previous high to be followed on by a parabolic spike as the following macro chart depicts.
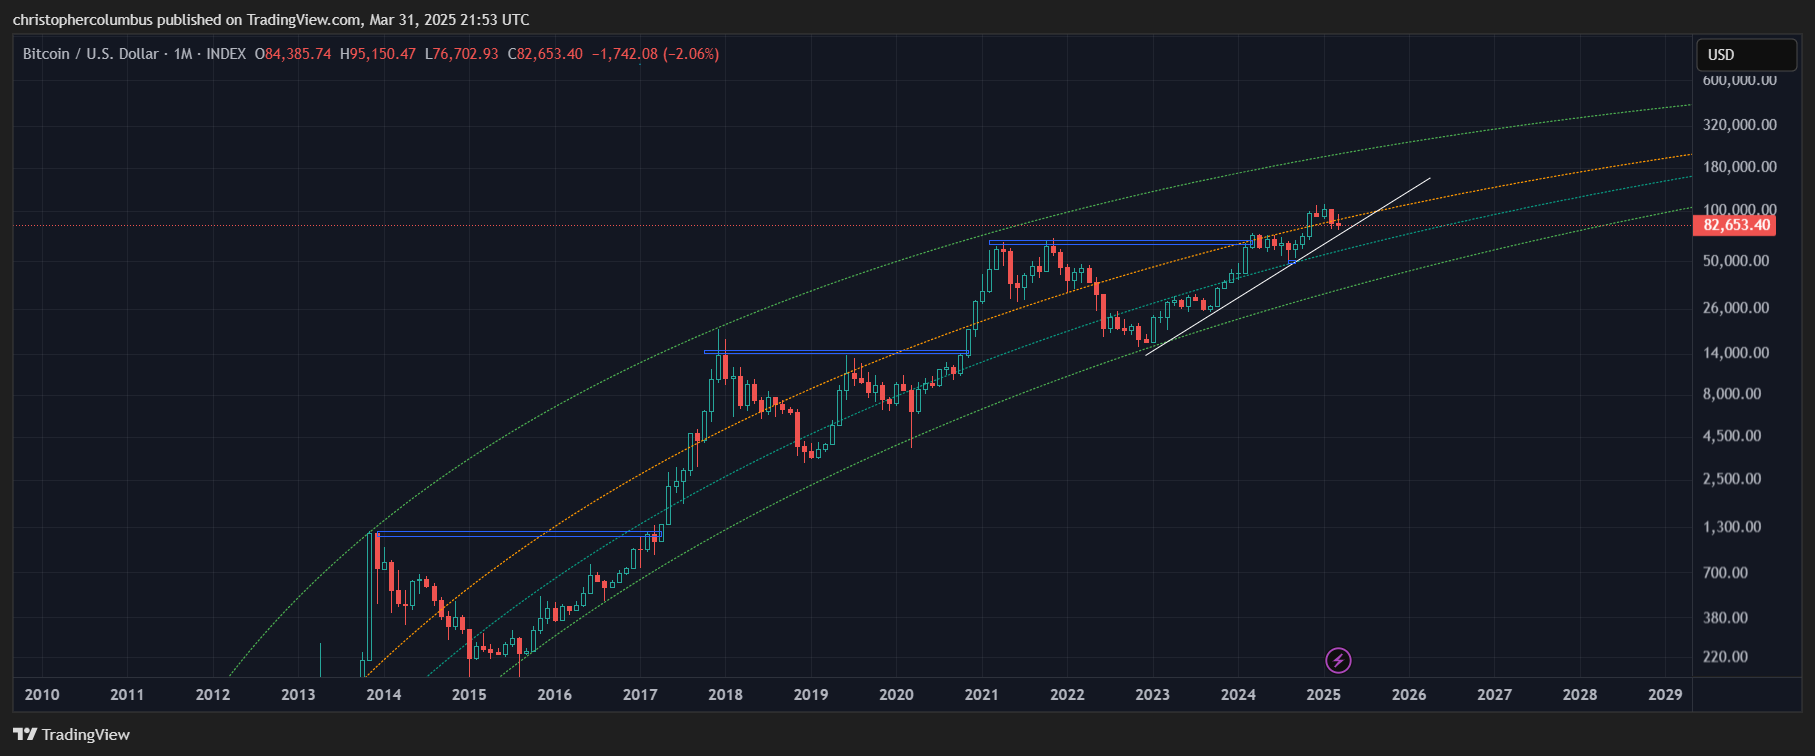
As we can see, no parabolic spike on the recovery of the previous highs, but the continuation of a solid technical move up. This kind of price action is also what the concept of a maturing market [qualitatively different to the market of previous cycles] would suggest with price following a more technical less parabolic nature, and with an eventual break to that 4 year cycle as previously seen. Time [this year] will tell whether the break of the 4 year cycle pattern will happen this cycle or the next.
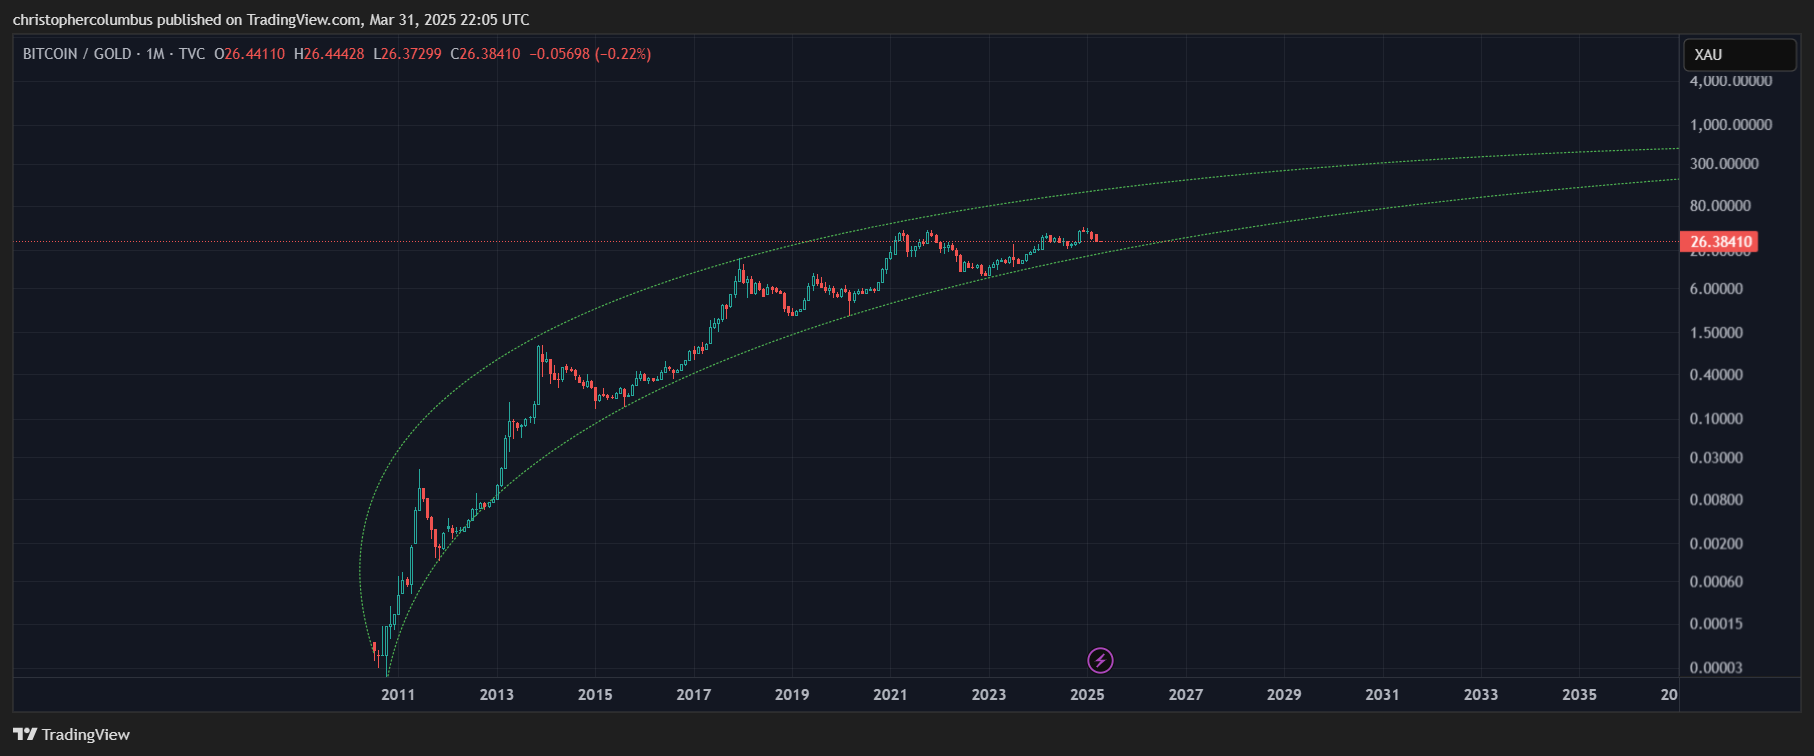
Though the expectations of many have been dashed, with sentiment low, the technical nature of the bull market remains in place. Until the technicals are convincingly broken, the default option in my opinion should continue to be bullish here, and for both traders and investors. Of course for longer-term investors, with a longer time horizon in mind, the LGC channel is the standard to watch in my opinion, one that signals an ongoing macro bull market with price currently located midway as priced in USD, and lower in the channel as priced in gold.
The Technicals of the Current Cycle
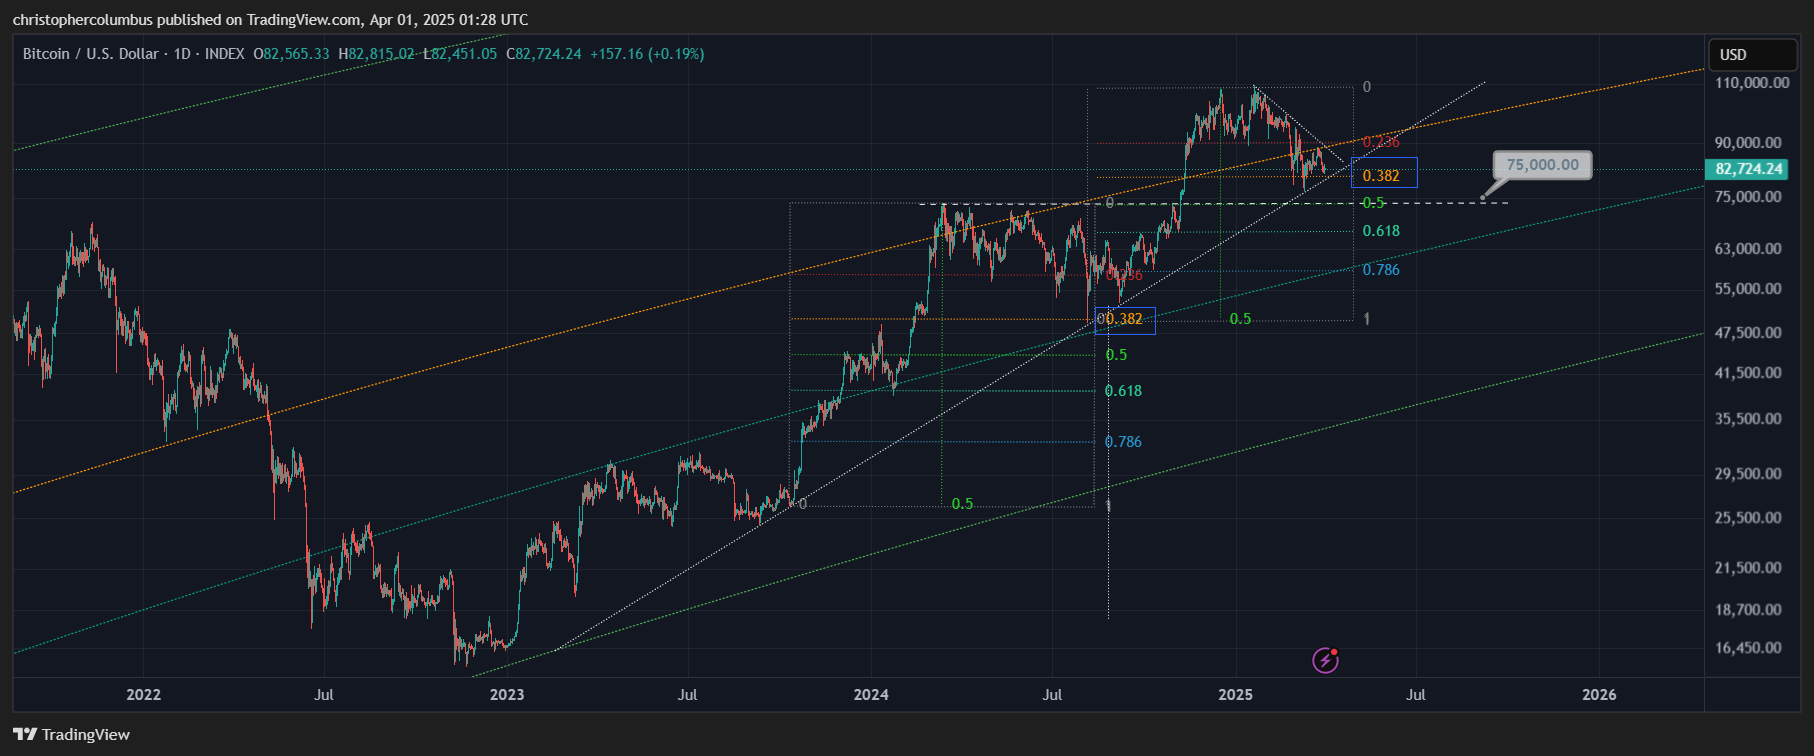
And so to a review of the technicals of this cycle. The general sentiment of the market is so low at the moment due to a nominal 30K odd decline off the top from the peak of near 110K down to the current 82K as of writing [25%]. On the face of it, the decline seems huge, but so too was the initial run up preceding that decline. This is where the chart and the technicals come into their own, in safeguarding against an over-reaction in sentiment to the correction, in providing a sense of proportion to price action.
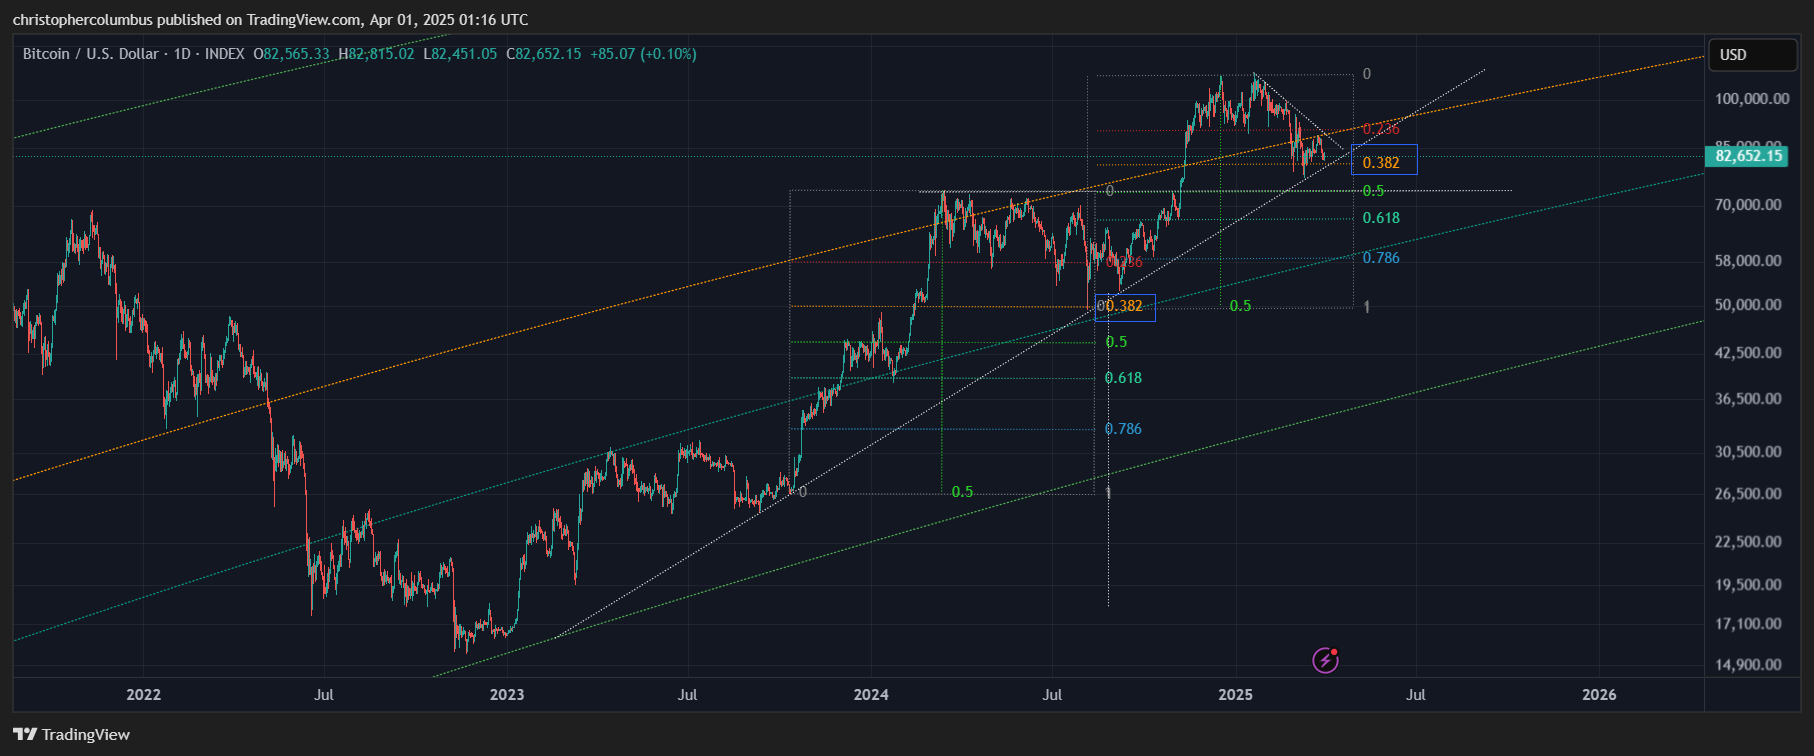
Here you have a 2 + year technical move with price observing the longer-term diagonal [representing 2x per annum]. As compared to the previous correction, this current correction is similar [38% in real terms]. Also significant is the time fib, where the correction is near equal to the previous run-up. This time fib also played out in the previous correction.
Only with a further correction below the 75K range, the 50% fib, and previous resistance come support, would I begin to think that the cyclical bull/ 4 year cycle was over, and a year-long bear could instead be in place [Dec ‘24 - Dec ‘25]. You always need to entertain some criteria by which your main outlook could be invalidated, and that would be mine. That said, there is still plenty of wiggle room for a continued/ renewed bull after this interim correction plays out.
The Longer-Term Momentum Indicator of the Weekly MACD
To end with, an update of the weekly MACD chart.
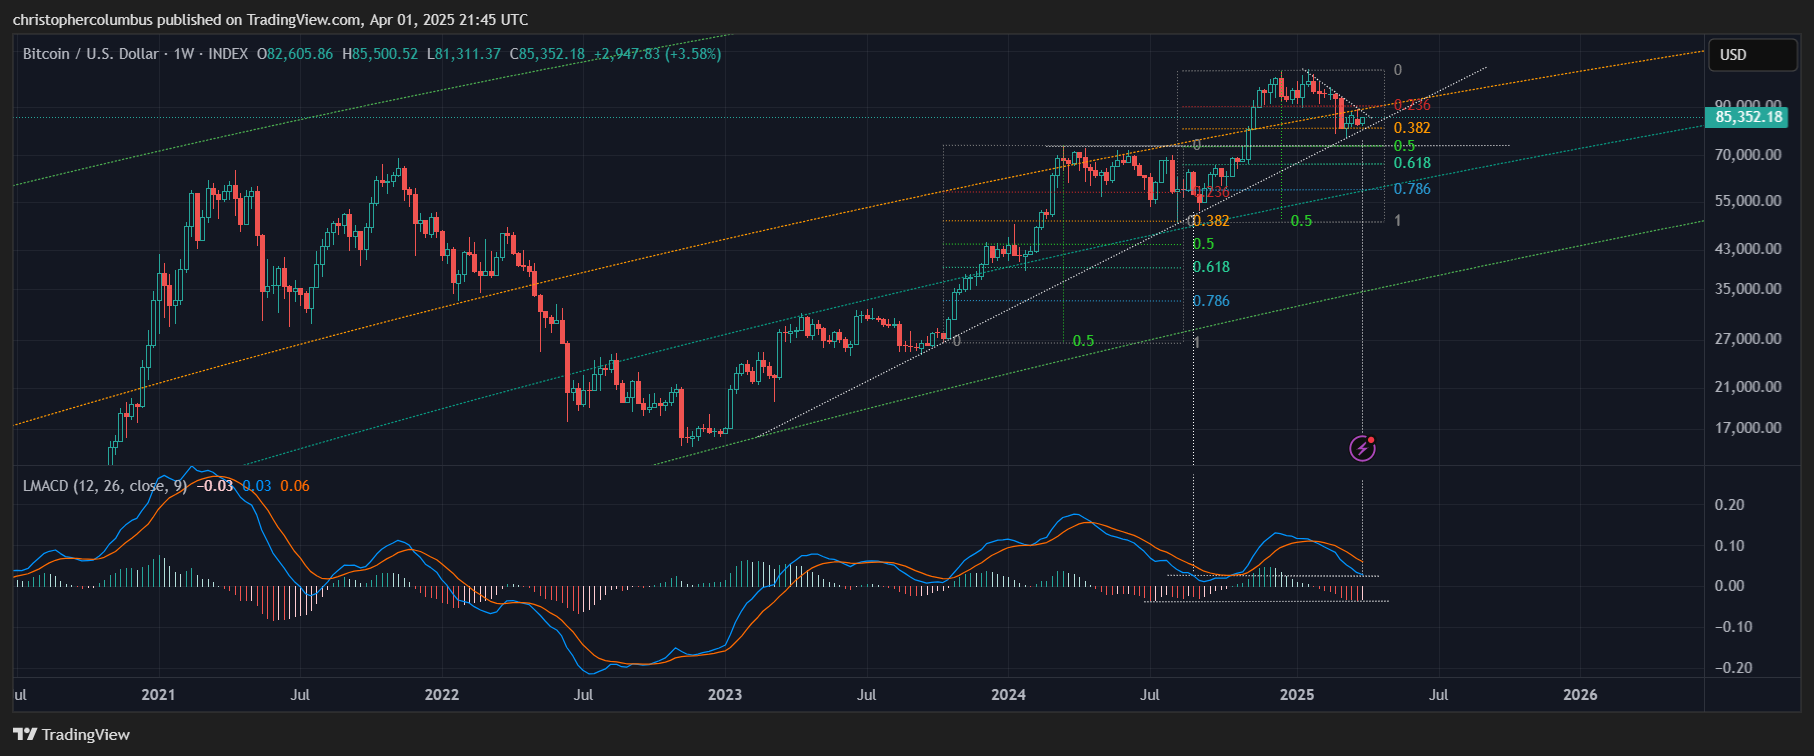
The weekly MACD line has consolidated back to near the zero-line. It is still above the zero-line and so still in bullish territory. Where currently located in comparison to the previous lengthy correction, it coincided with the price low. It will be interesting to see if the week closes with the first contracting histogram printed for quite some time [currently flipped to white], which would signal the reversal of the weakening momentum as the MACD tracked south.
Zooming out on the Weekly MACD
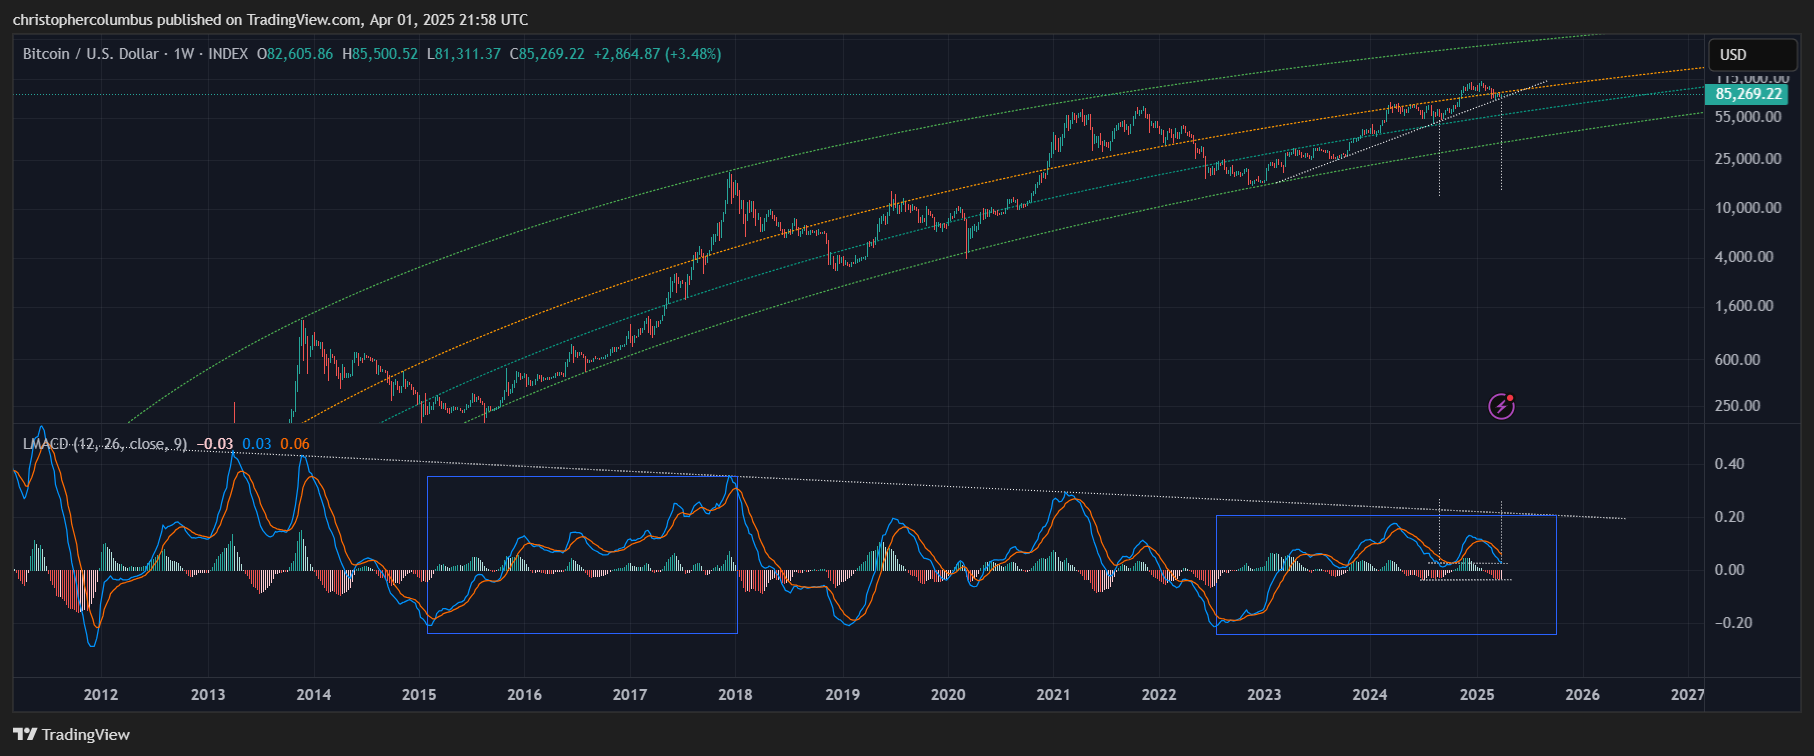
Zooming out on the chart can be helpful insofar as you can compare the dynamic of the MACD across various cycles, but is also limited as the market has undergone a qualitative change over the years as it has become further capitalized on its path toward price discovery [as a currency relative to others].
Given the regular nature of this cycle, the best comparison to be found is to the 2015-2018 period. Currently, I am looking for another move up in the MACD to near the long term downward diagonal as marked on the chart, which would also coincide with a 4 year cycle.
Until next time,
Stay [relatively] safe out there,
Dave the Wave.