
Bull Market Continued?
Dear Readers,


Naturally, after a year’s 4.6x run off the bottom that pushed through the 70K mark, and now with an extended consolidation period that threatens to move into the 50K range, the Bitcoiner asks whether the bull run is over. And a perfectly natural question it is also with both price and sentiment unwinding. However, this is what the technicals are for. They serve to ask the more rational questions of price action as shown on the chart. As we all know, bull markets are said to climb a wall of worry, and in this sense negative sentiment becomes a positive.
First of, we need to shift the chart from the linear to the logarithmic scale in order to reflect the nature of exponential gains. This is because if we focus too much on the numbers of the linear scale [as opposed to the rate of appreciation of the logarithmic scale] our perception of the price consolidation can be distorted. And so to the log scale that shows a less exaggerated decline then the first linear chart.

Still, the chart looks toppy after a solid run that threatened to turn parabolic proper until the latest uptrend/ rate of appreciation was broken to the downside. The question remains - is this just a pause and a consolidation before the bull market is renewed, or are we in for yet another extended correction. Here further technical analysis can provide a weighted and balanced response to the question, where if it can not be answered definitely, given TA is not clairvoyance, it can function in diffusing an overly negative reaction, one equal and opposite to the previous exuberance on the ascent; in short, TA serves to correct the sentiment.
Medium Term TA
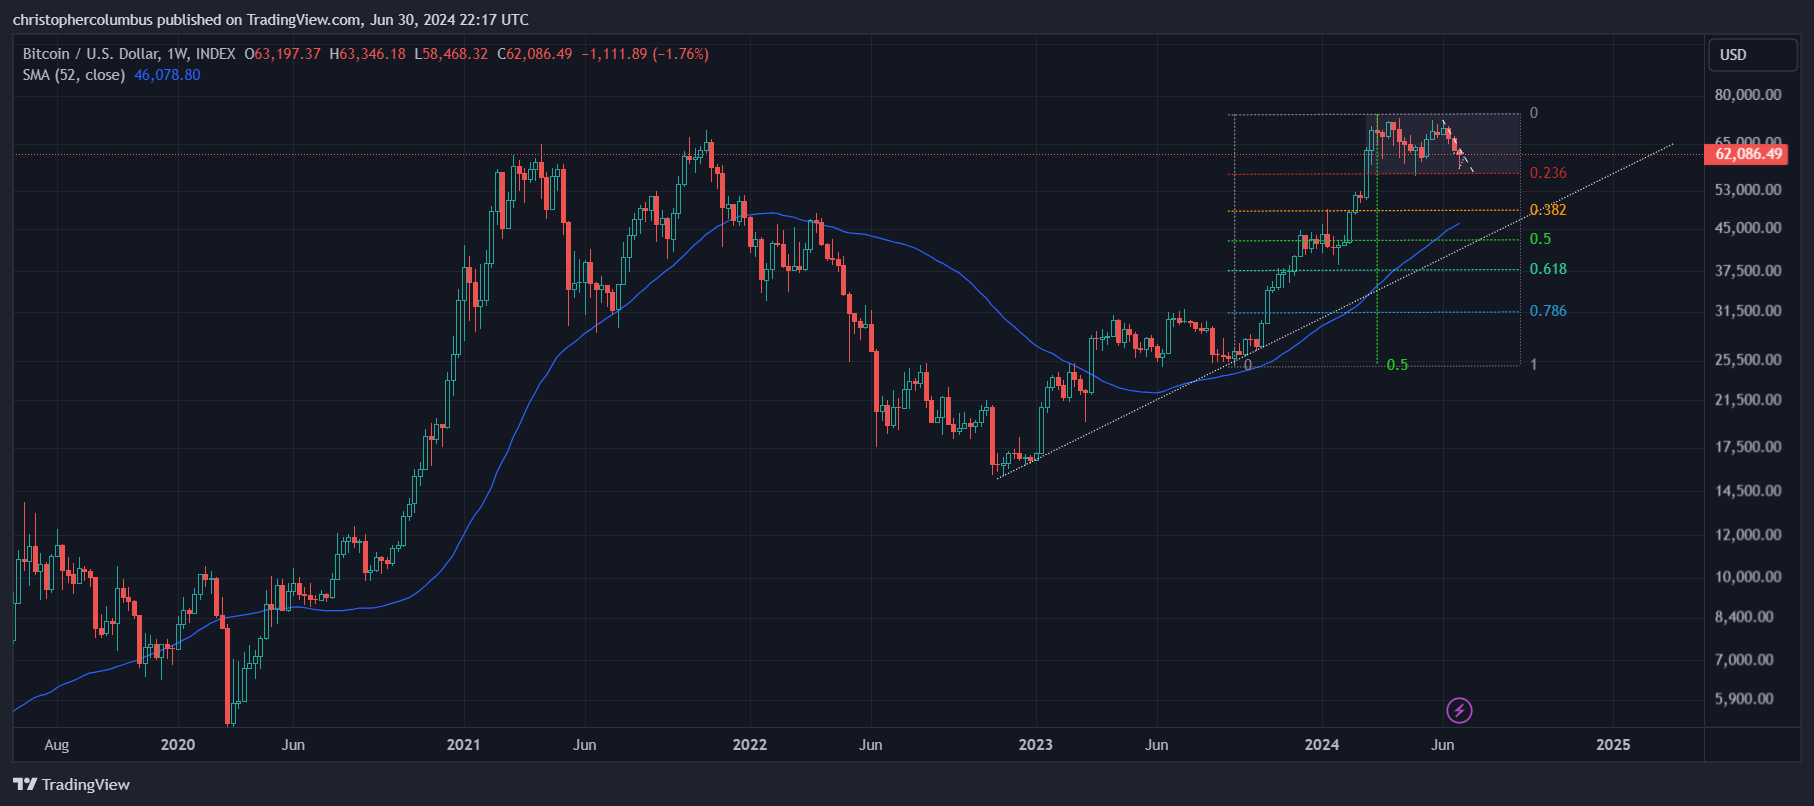
I’ve moved straight to the more medium-term TA as it’s my opinion that TA is more effective on the longer timeframes. Of note here:
- the one year moving average of price, where currently price is well-extended while that MA is steeply ascending to meet it
- the medium term trend-line that roughly correlates to the MA
- the price fib measurement of the move up [taken from the previous move which was well-consolidated] showing so far the top level fib forming a range [shaded area]
- the time fib measurement suggesting further consolidation
The real takeaway for the investor as portrayed by these technical factors imo is that even if a further correction plays out to the next 0.38 level of the fib this would not entail the negation of a developing bull market [since the beginning of last year, 2023]. Rather, it would potentially put price action in a more stable and sustainable trend going forward. What is significant here imo is that a full blown parabola did not develop, or even a ‘mini-parabola’. Instead, the price action has been relatively conservative and unfolded along more technical lines. Going forward, this suggests that the correction also will be more technical as opposed to an extended collapse that is seen after a parabolic rise.
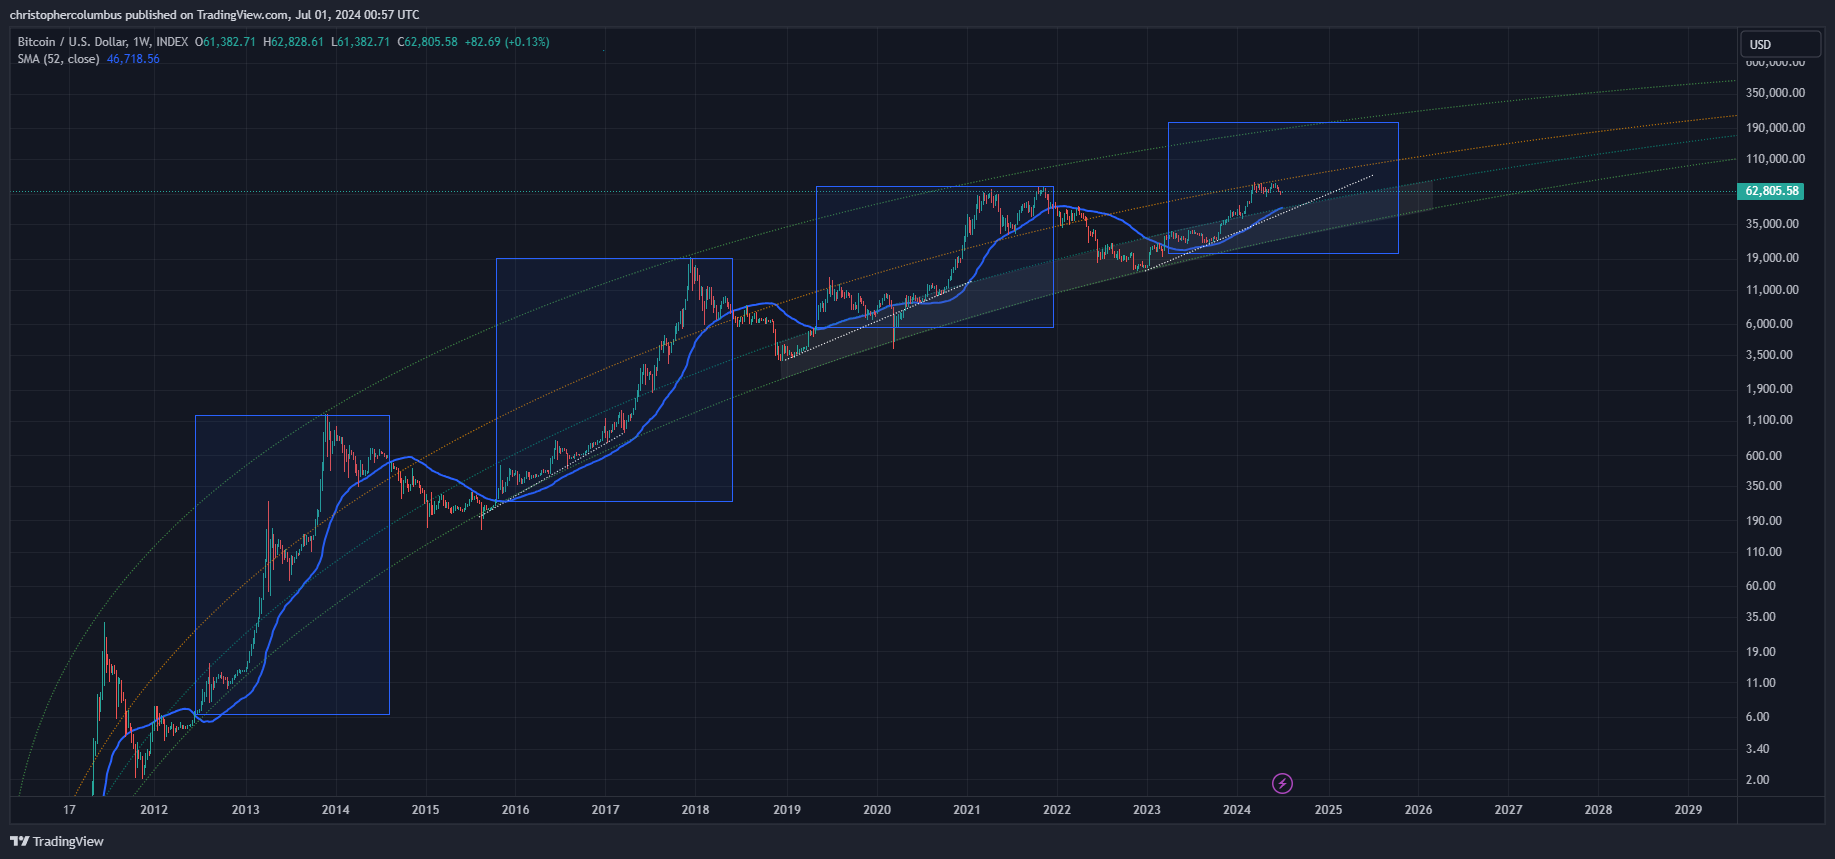
Macro of the LGC Overlaid onto the Technicals
Zooming further out to the macro, where the LGC model is overlaid onto the technicals, and where the trend of price becomes weightier on the longer-term time-frame, we can see that price is in a healthy spot - yet to have broken through into the upper channel where it could be said to be getting over-heated.
Also noticeable is the lack of that mini-parabolic move as seen in 2019, which preceded the subsequent and very solid correction. As mentioned previously, this time round the price dynamic looks less exuberant and technically setting up for first a less drastic correction followed potentially by the continuation of a bullish market.

A Macro Focus on the One Year MA

While the technicals continue to look healthy, the investor naturally asks whether price, on the longer-term, or rather on the more medium-term, will move into the upper channel or fully correct back to the bottom of the LGC. Though this medium term move can obviously not be definitely answered [while remaining confident, never certain, of the LGC channel holding on the longer-term], I find the one year moving average here suggestive and of interest in predicting the probability. In my opinion, this moving average provides a weighted outlook for further consolidation in the immediate-term and a continued uptrend in the medium-term for the following reasons.
At first sight, you can see that once the bull markets got going price did not fall back through the yearly moving average except for 2020. In this context it could be considered an anomaly, and as previously mentioned this came on the back of a mini-parabolic spike up in 2019 to provide a reason for the break. Additionally, this break was very temporary. Given this, I think it reasonable to have an expectation that the yearly moving average will continue to provide support moving forward as envisaged in the following chart.
My aim in this article has been to show how the consolidation of price in the shorter-term is consistent with a continued bull market in the longer-term. Yes, the investor may have bought a little high on the previous run-up, but a continued bull market should ‘rescue’ him. Will price return to the shaded LGC buyzone [the top of which currently lines up with the yearly moving average, the medium-term diagonal trendline, and the 0.38 fib retracement]? Possibly, and that then would be a risk-managed buy.
Until next time,
Stay, relatively, safe out there,
Dave the Wave.