
Latecomer to the BTC Market?

Dear Readers,
With price finally hitting the 0.38 retracement of this recent move on the fib, I was expecting today to write on the reasonableness of an entry for the latecomer to the market, one that had missed the earlier LGC buy zone at lower levels.
But ‘low’ and behold, the recent Donald social media posts that has functioned to ‘spruik’ the market. Yes, we get the daily pump [10%], but I think that only serves to heighten the volatility. The market has a way of absorbing this kind of volatility back into longer-term trends.
Short Term Chart
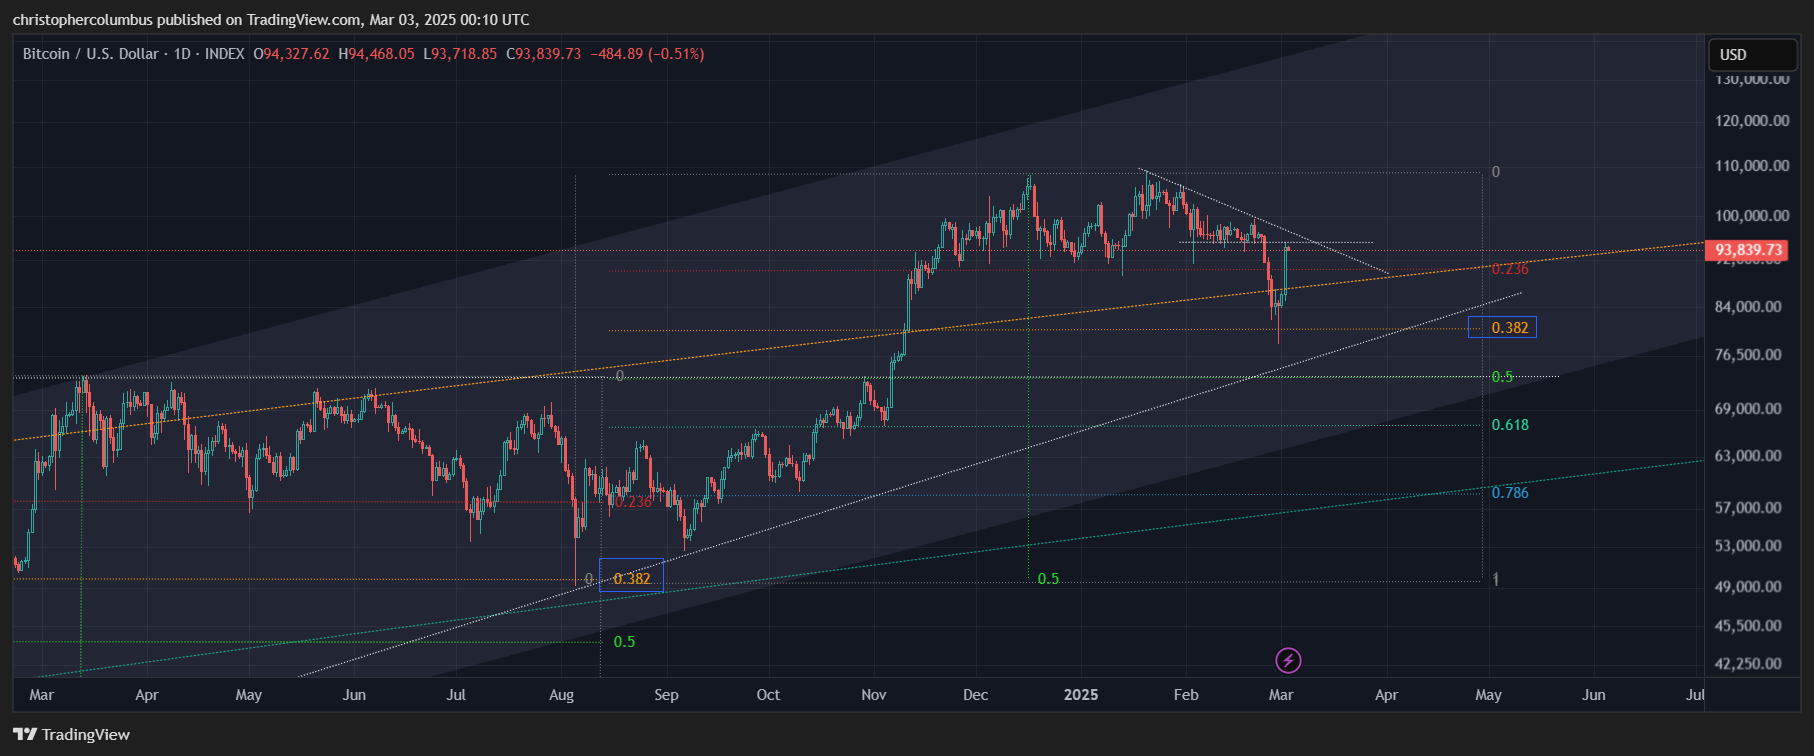
As we can see, on a solid day up price is currently hitting those shorter-term resistances. Given also the time fib, it’s reasonable to look for further sideward ranging price action in that shorter-term.
I’m sure that a few, that had been sitting on the sidelines, whether investors or traders, had entered on their bids being hit on the wick through the 0.38 level. They’d now be sitting on a solid position 15% up, but can perhaps also expect a rocky and volatile road over the next couple of months or so as the correction runs its course [in consideration of the time fib].
Longer-Term Chart
And of course the chart that hodlers and investors are going to be more interested in. Despite the volatility, the trend is up. As long as the trend continues, the default position has to be bullish not bearish. Where the sentiment of the market can turn people bearish on the volatility, always part and parcel of this market, the TA functions to siphon off the frothiness of both the daily volatility of price and sentiment. That price is currently high naturally feeds into bearishness when it moves in multiples of thousands of dollars. Yet these moves, in percentage terms, are Bitcoin normal.
And to the more technical view of the longer term/ current bull run.
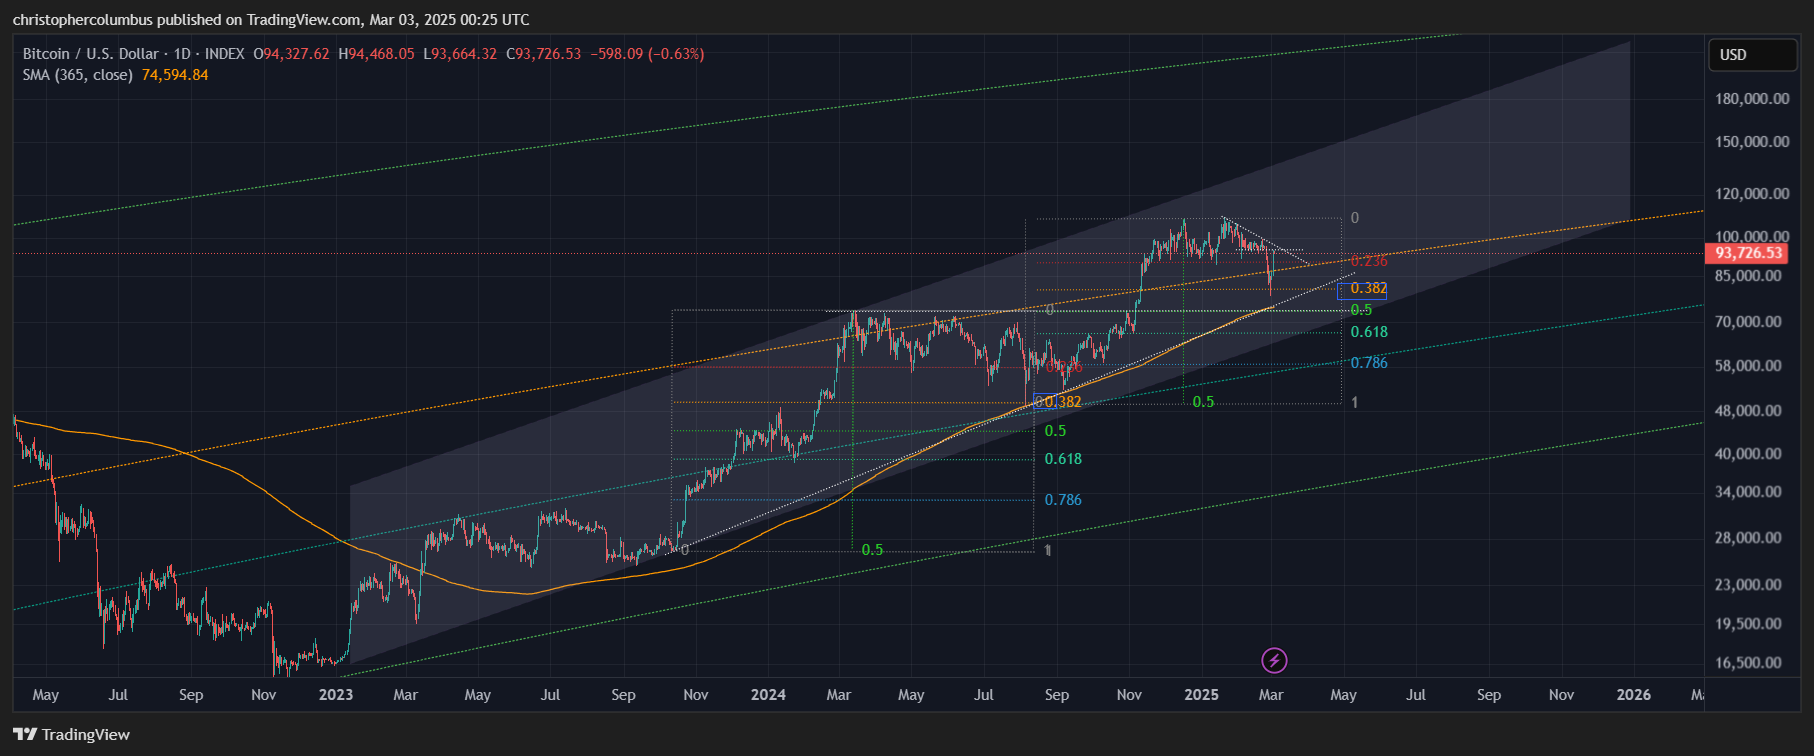
Technical factors suggesting continued strength in the market:
- Longer term upward channel [shaded area]
- 1 year moving average providing support
- Previous resistance providing support
- Longer term upward diagonal providing support
- Continuation of correction following on from previous move up
- Well situated within a multi-year cycle
In a word, technically solid.
Outlook for the Year
Moving forward, I think the prospective buyer has a good chance of seeing that one year moving average tested, which is likely to coincide with a re-test of the 0.38 fib [as the market ranges sideward in a wide still volatile channel.
I would not be at all surprised to see the first half of the year to be one of a continued consolidation in price at these levels, and then the move to new highs over the course of the second half of the year.
To Chart the Market, not Market the Chart
Finally, to touch on the issue of ‘spruiking’ or the marketing of Crypto once again. No doubt many want to see it, but I don’t think it is necessary and only leads to temporary volatility. Rather, I think we can trust the process of the market moving over time in a more organic and natural manner, where at times the market will cool down after first getting over-heated.
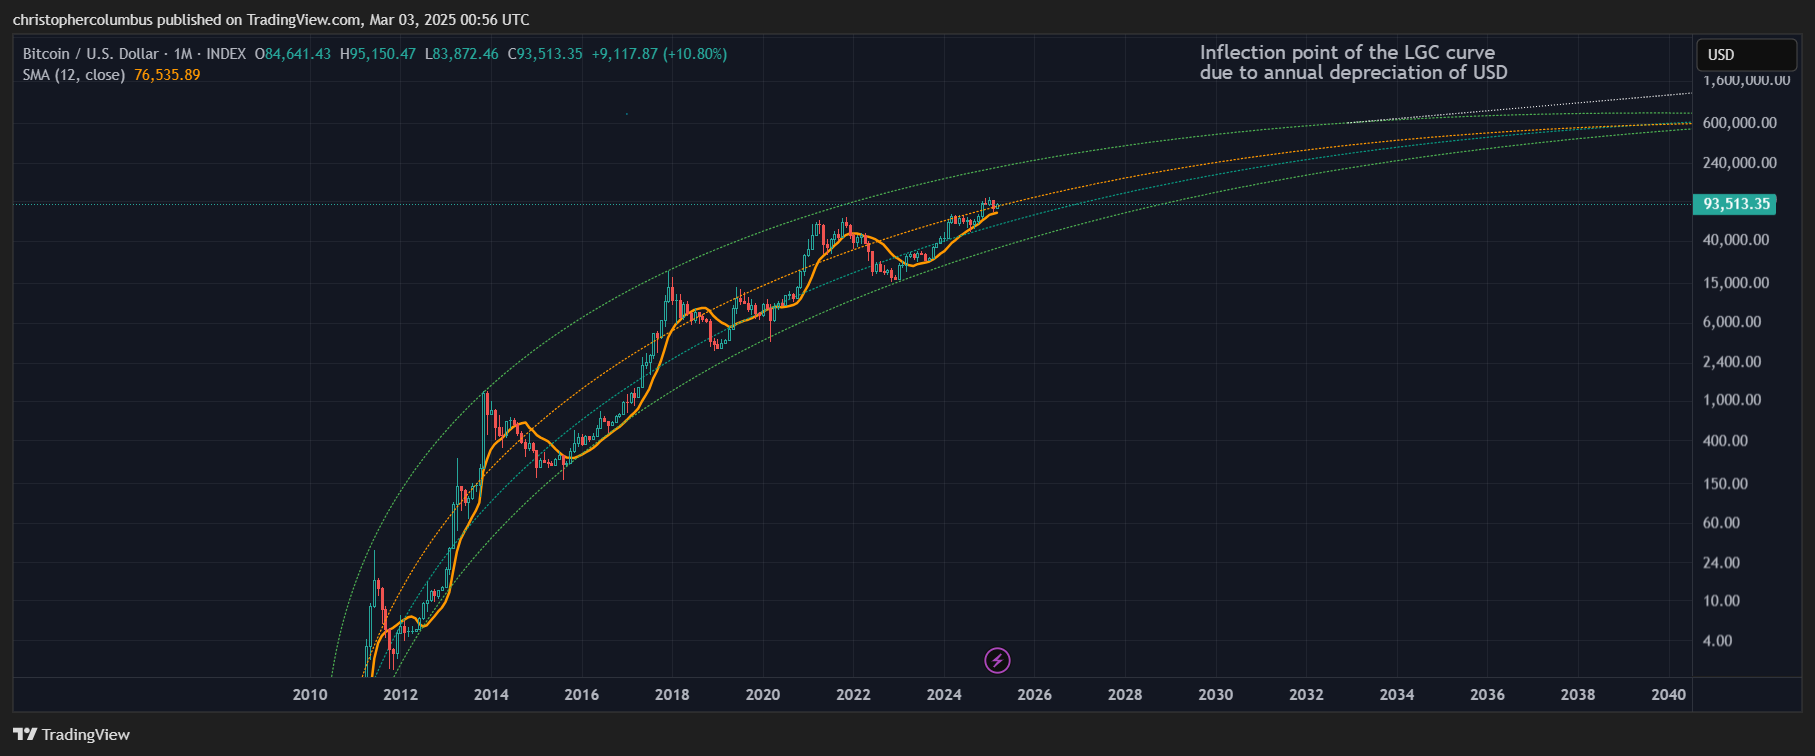
The reason investors are buying BTC [with investors always interested more in the longer-term trend] is that BTC is considered digital gold. The rationale for it increasing in price over time is not the marketing [which can only provide temporary volatility], but that it is in a process of capitalization, rapid at the start while culminating in a plateau at the end [the Logarithmic Growth Curve]. In the interim period, we can say that the market is maturing over time. This process also leads to a reduction in macro volatility, which is something clearly seen on that 1 year moving average.
That we also see the market continuing to move within technical as opposed to parabolic parameters is also something to be expected in a maturing market.
Until next time,
Stay [relatively] safe out there,
Dave the Wave.