
The Macro Stress Test
Dear Readers,
I thought in this fortnightly round I’d respond to a question I received on X concerning the BTC market - “What about trumps tariffs and policies torpedoing the market, do you think that’ll still have an effect?”
With market sentiment pushing all time lows at the moment, and stress levels all time highs [something we’ve seen before], people are naturally asking whether the market might be broken. Where is the QE/ quantitative easing they ask, where is the fast and loose monetary supply, is this administration not careless of markets and welcoming some economic pain going forward?
In short, these queries serve to cast some doubt on the narrative that has always served to bolster confidence in BTC, that is is primarily an inflation hedge. In this scenario BTC is akin to a commodity, even if a digital one, and valuable because scarce. As money printing ramps up, so too does the price of gold. Yet, what if the taps are turned off? In this scenario, if markets were to all crash, wouldn’t the price of BTC also?
Of course, this is not the first time that these deflationary concerns have raised their ugly head, and is something I grappled with in an article a while back. Perhaps it is timely to review the argument that though BTC will no doubt remain volatile in such a scenario, the price is likely to continue up [in the more modest LGC channel] for the following reason.
Like Gold, BTC is also a Currency
If I’m going to compare BTC to gold, or digital gold, as we all do, a comparison of the charts might be helpful. The charts are obviously very different, which also goes someway to explaining the current development of price on the BTC chart.
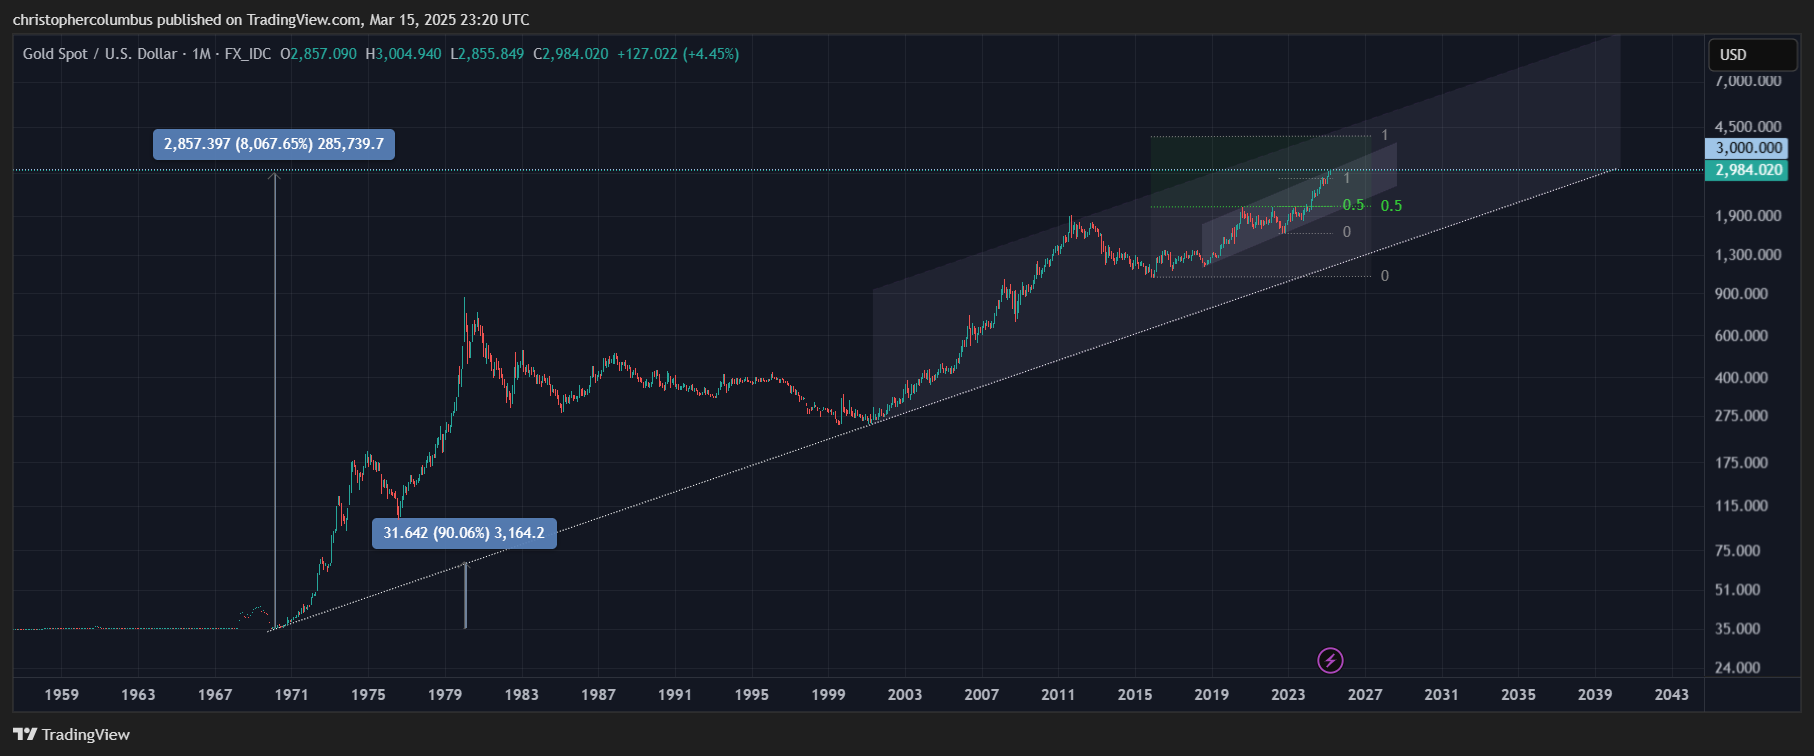
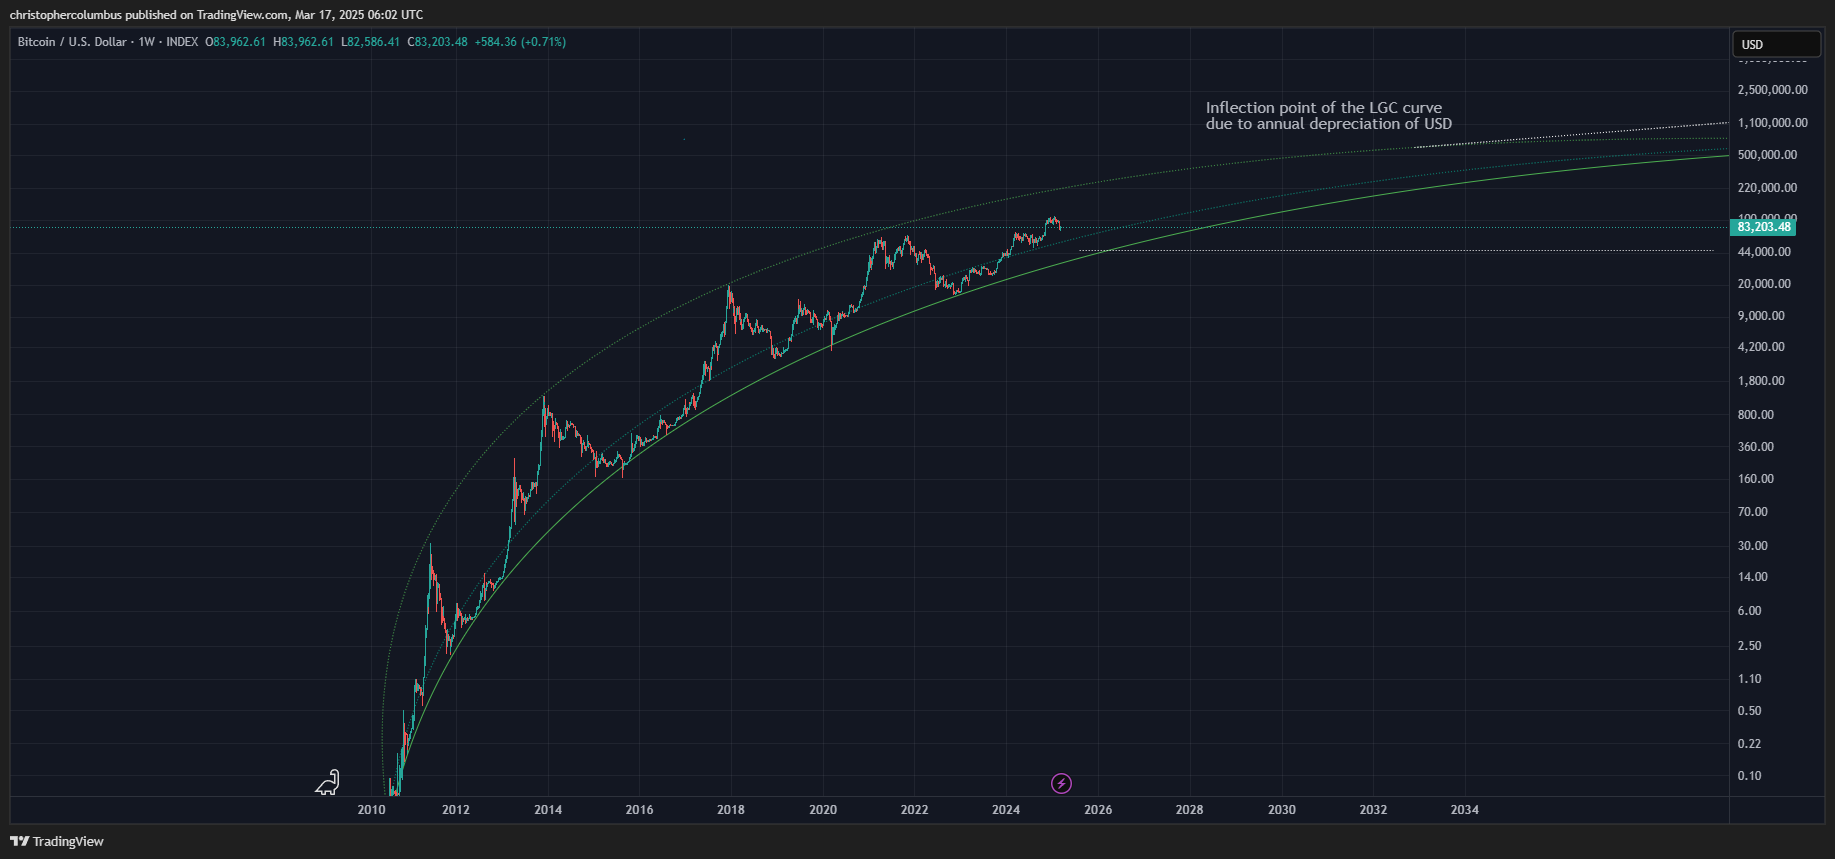
No doubt followers on X are quite familiar with the gold chart that I post from time to time. First is the very prolonged nature of the chart showing price appreciation since gold came of the USD fixed standard to float in a free market.
The rate of appreciation is a relatively 2x compounding annually. In contrast, the extreme annual exponential moves that we see on the BTC chart is due to the fact that BTC is a currency [digital alternative] in the process of capitalization, whereas gold has already been capitalized for millennia.
With gold also considered as a currency, the gold/ USD chart really just reflects the depreciation of USD over time. Accordingly, to represent this, it makes better sense to invert the chart, which quite literally shows that depreciation.
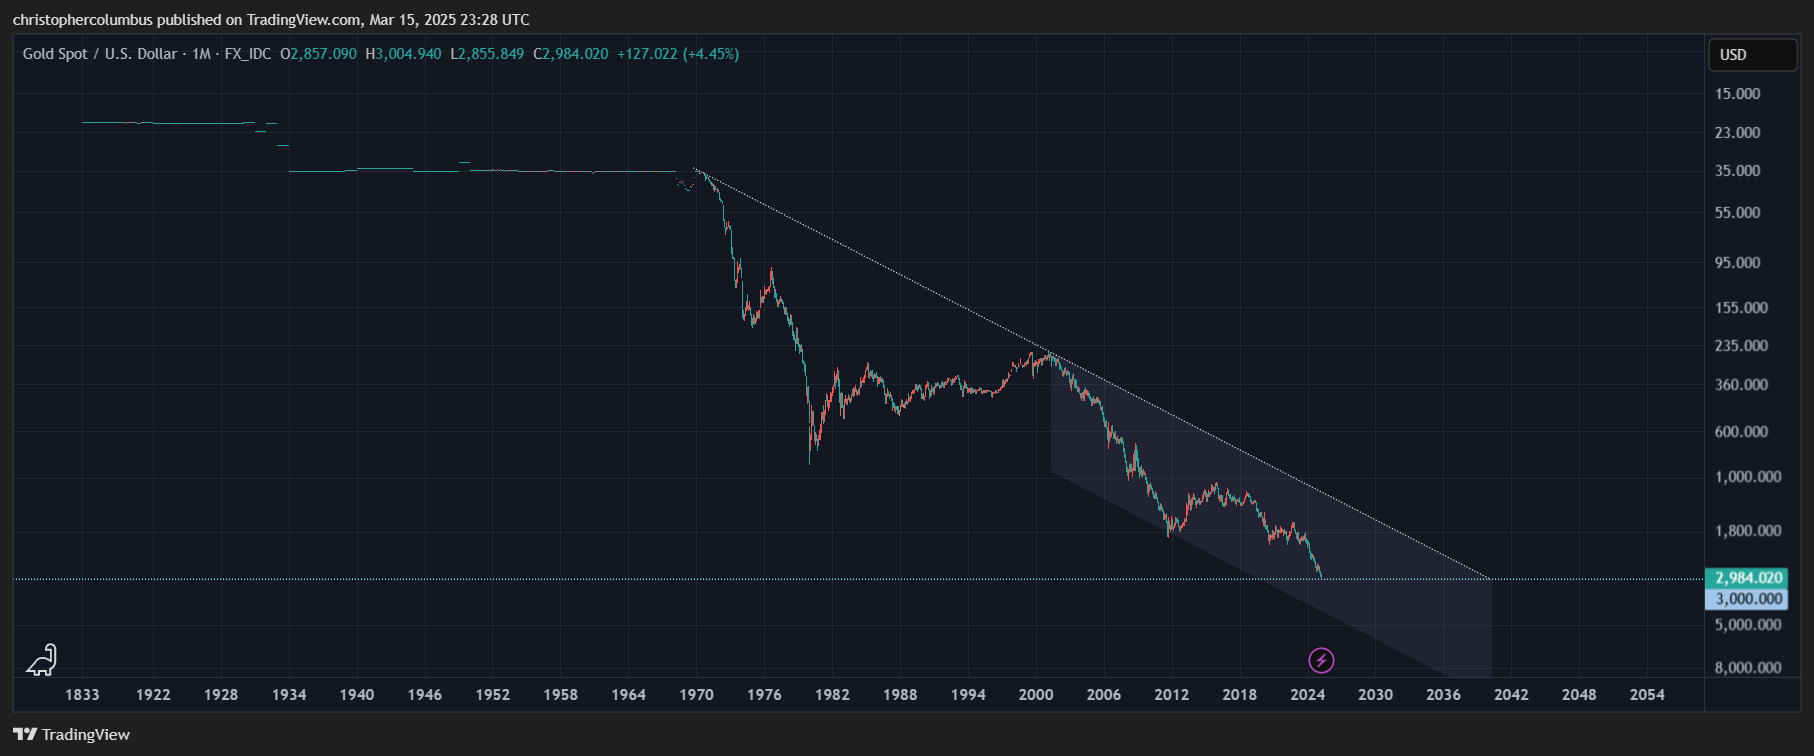
USD is not what it once was, and really is the same currency in name only. It is quite a different currency to what it was decades and even a century ago. On the one hand, hyper-inflationary fear rears its head on viewing the chart, and yet on the other this has been a managed and relatively stable descent due to the debt-backed nature of the currency. It is not backed by nothing as Weimar paper money was - the debt is real.
And yet we also face episodes of deflation where the over-all inflationary picture is reversed for a period of time. These are the concerns investors face now in fearing markets could melt down in a deflationary spiral, where money on the ‘periphery’, in developing economies and in inflated asset prices, could suddenly be sucked back into the center, back into USD the world’s reserve currency.
And this brings me to an earlier article written some time back, when investors were then facing the same kind of concerns and when Bitcoin was in the 13K range.
Given the background of an uncertain macro-economic landscape, the Bitcoin chart presents itself as something of a conundrum. On the one hand, with [hyper] inflationary concerns in mind, Bitcoin is considered to be the perfect response, where it functions as an inflation hedge, a sponge of sorts like any asset, to soak up all the excess liquidity perceived to be in abundance. We’re all familiar with the theory based as it is on money supply and central banks response to deflationary forces of one kind or another - the reflation of a deflating economy. On the other hand, those deflationary forces remain defiant [in spite of monetary theory], and hang like the sword of Damocles, over asset prices. You’d not have to go back many years to see central banks boasting that deflation was of zero concern given their ability to manage conventional currencies. With the benefit of hindsight [or with some scruples about a theory at that time], we can see it was not so. Once again, we’re all familiar with the countering theory of deflation.
The way out of this dilemma, insofar as it involves investing in Bitcoin or not, is to re-think what Bitcoin actually is from a macro-economic perspective. If Bitcoin can make sense with both inflationary and deflationary narratives [arguably opposite sides of the same crisis coin], then investment in Bitcoin becomes a much less fraught decision.
What is common to both narratives here, as is typified in the ‘inflation/ deflation debate’, is an understanding of Bitcoin as an asset. It is due to this common understanding that one camp is willing to buy Bitcoin and the other is not - in inflation, asset prices go up; in deflation, asset prices go down. Yet the picture changes radically when instead of conceiving Bitcoin as an asset, we conceive of it rather as a currency. For those also in the deflationary camp, or even for the undecided on the fence, Bitcoin now becomes attractive. For in deflation, monetary value erodes out of assets and into [the strongest] currencies/ forms of liquidity, and Bitcoin, is just one such form of liquidity [though currently more of a ‘wildcard’ form]. And on the face of it, Bitcoin has always claimed to be a currency, a form of money, despite some re-conceiving it as only an asset. Indeed, it was in order to solve the perceived problems facing conventional currencies that it was created in the first place – a monetary response to a monetary problem. Consider also that countries and investors might want some diversification in their currency holdings besides USD, especially with geo-political uncertainty. Of course, the obvious objection here is that Bitcoin is much too volatile to function as a currency, which is a point I’ll come to shortly.
Deflationary concerns also go some way to explaining the volatile swings in Bitcoin to the downside, which have always been proportional corrections to the previous exponential moves to the upside. As much of BTC investment ostensibly involves buying it as an asset/ inflation hedge, and then again on pure speculation, it’s no surprise that price should correct when uncertainty once again dominates the market, as to either the speculative price, or to the wider macro-economic landscape. Yet, once corrected, the price becomes more sustainable. This pattern of alternating explosive and corrective movements in the price [also seen as cycles] has led to the formation of a converging channel atop of the LGC [figures 1 and 2 above]. An extrapolation of this converging channel then gives you a picture of both eventual price discovery/ stabilization and reducing macro volatility [the convergence of the channel]. The volatility within the parameters of this converging channel are compatible with a market divided between two narratives - the fear of missing out [FOMO] creates the spike, and then fear per se [of too high a speculative price] that leads to the correction. But in the aggregate, you still see the macro trend of the LGC playing out, and it’s actually these existing deflationary concerns, the fear and uncertainty, that brings the volatile and speculative price back down to earth, or should I say, back to the LGC.
Which brings us back to the question as to how Bitcoin could be a currency if so volatile. As outlined above, a solid underlying trend is actually observable and distinguishable from the huge volatility that ranges back and forth from it. My explanation for this is that Bitcoin is a nascent currency in the process of capitalization, and hence the exponential moves, even while those moves are diminishing toward an eventual price discovery/ capitalization.
As for this ‘nascent currency in the process of capitalization’, I’ve always conceptualized this as the logarithmic growth curve [the LGC model], and further as something that has actually been empirically tested and confirmed over time as developing on the chart over the past six years.
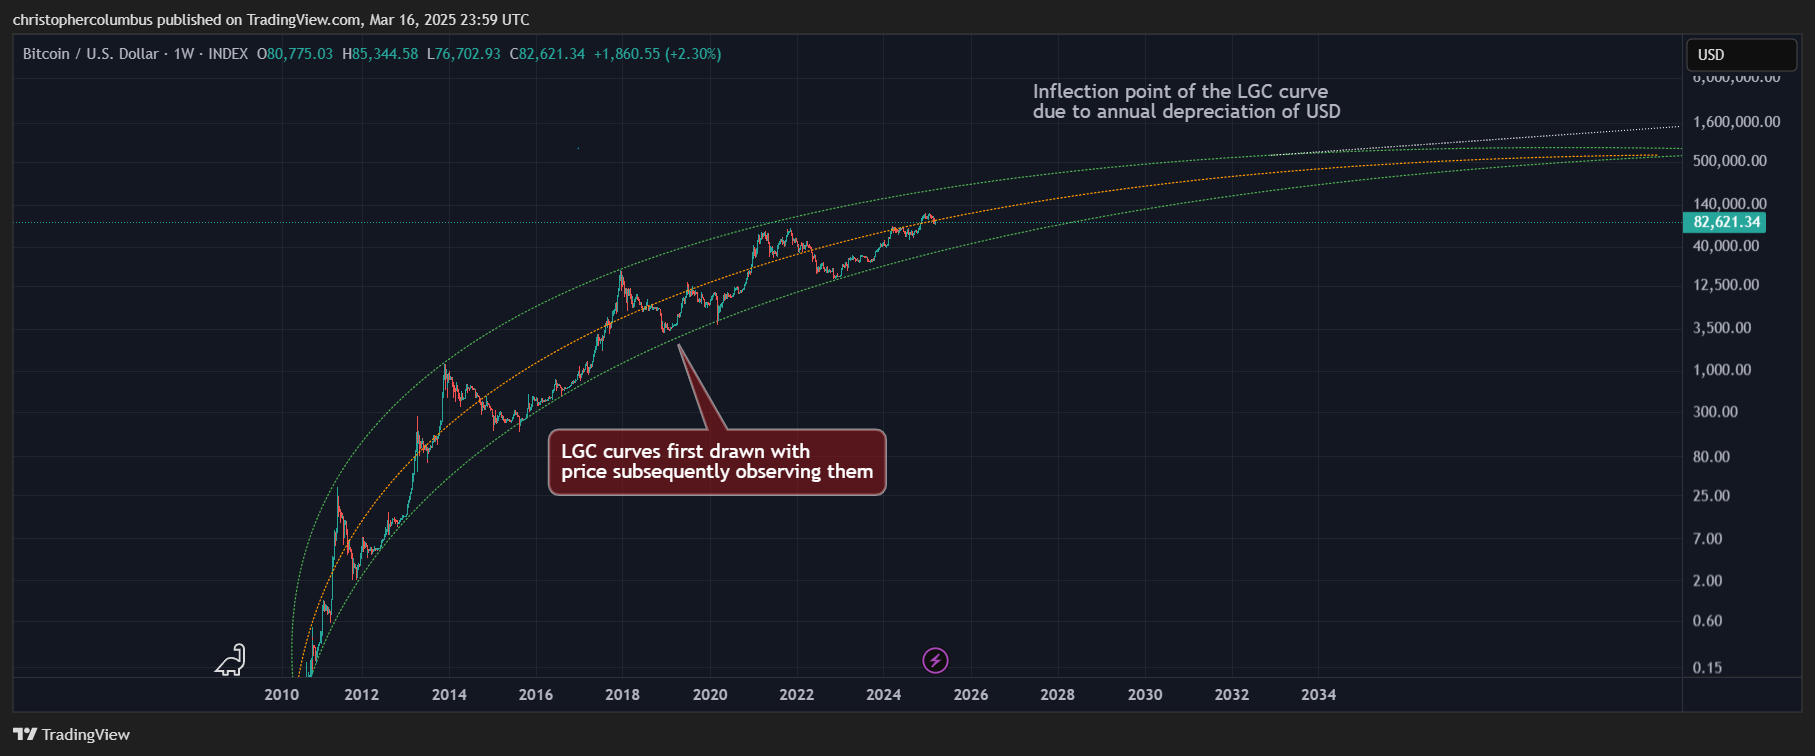
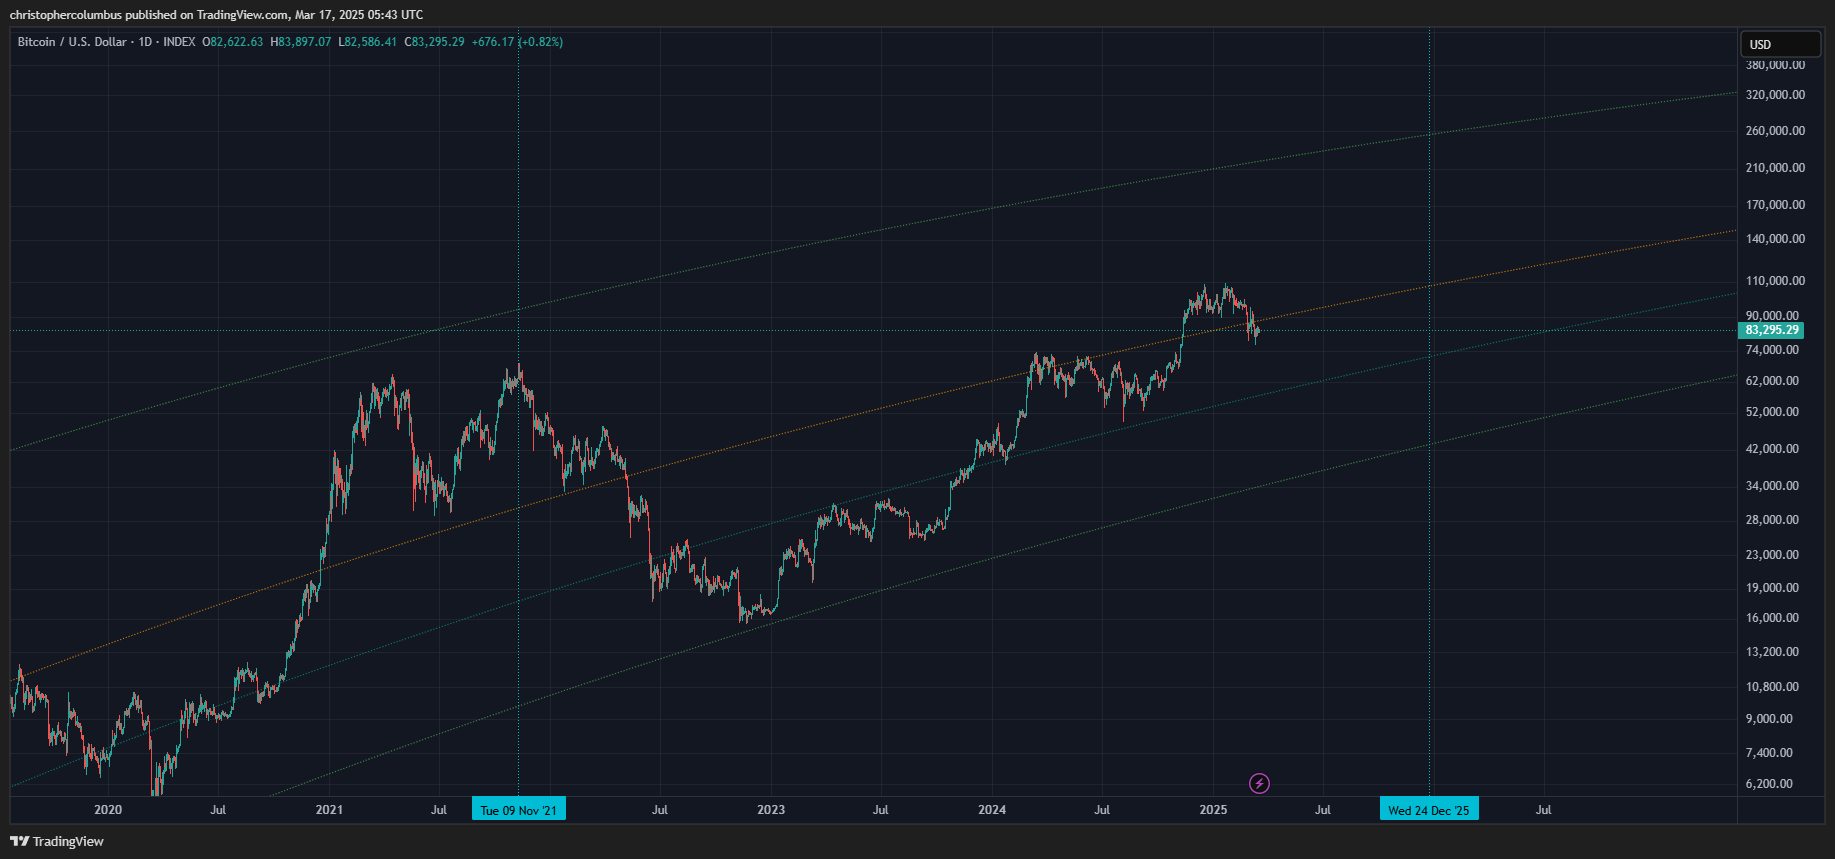
Zooming in, we can see that price is at an interesting juncture here being situated right at the midway point of the LGC channel [converging and plateauing over time]. It’s interesting to overlay the popular 4 year model, that most have in mind, to see that price would have to get going to complete that cycle in a heated market into the upper range.
It’s also interesting to note that even if the 4 year cycle/ model breaks, with a continued macro correction downward, on the off-chance that markets do melt down in some crisis, this would not invalidate the LGC itself… just the 4 year cycle, which leads to the macro stress test.
The Macro stress Test - a Break of the Expected Year Cycle
In doing a macro stress test here, the aim is to guard against a complete panic on the part of investors, on the off-chance the 4 year cycle is broken with a continued year-long correction and break of the cyclical trend. Yes, markets sell off when they are spooked in say a time of geo-political uncertainty, and Bitcoin would likely also be caught up in some liquidity event should that occur.
But keep in mind that BTC is an alternative currency as well as a scarce [digital] commodity. The logic of the LGC model is for a continued process of capitalization along a growth curve. Though the 4 year cycle can be overlaid onto the LGC, the LGC itself cares nothing for the 4 year cycle. Indeed, when we take into account the principle that Bitcoin is a maturing market, that 4 year cycle is bound to break at some time - if not this cycle, then the cycle.
And here we consider the break of that 4 year cycle this year in a macro stress test.

To look at the LGC channel again, and this time without the overlaid 4 year cycle, price in LGC terms could conceivably go as low as 44K in the course of the year without invalidating the LGC model. It would remain intact and serve as support for higher prices at a later date. Keep in mind that this is a stress test, the entertaining for the moment of a very bad scenario, a near complete meltdown in markets, and how that might affect the whole project of Bitcoin itself. The boy scout is always prepared.
Even if price went that low, once again lower than the previous peak [which was near inconceivable at the time] a near million dollar price in a decade’s time is still modelled and predicted as this digital currency continues to be capitalized, continues on its path to a plateau/ virtual capitalization [for those concerned about the future of USD, this LGC is clearly also represented on the gold chart].
To end with, I’ll bring this back to the technicals which are still supportive of the 4 year cycle contra the macro stress test. It is only if those technicals are significantly broken to the downside that the stress test for the longer term investor would come into play.
If your investment horizon stretches out beyond the next couple of years, and if you’d bought the LGC ‘buy zone’ [the lower band], then a longer correction or consolidation could be absorbed.
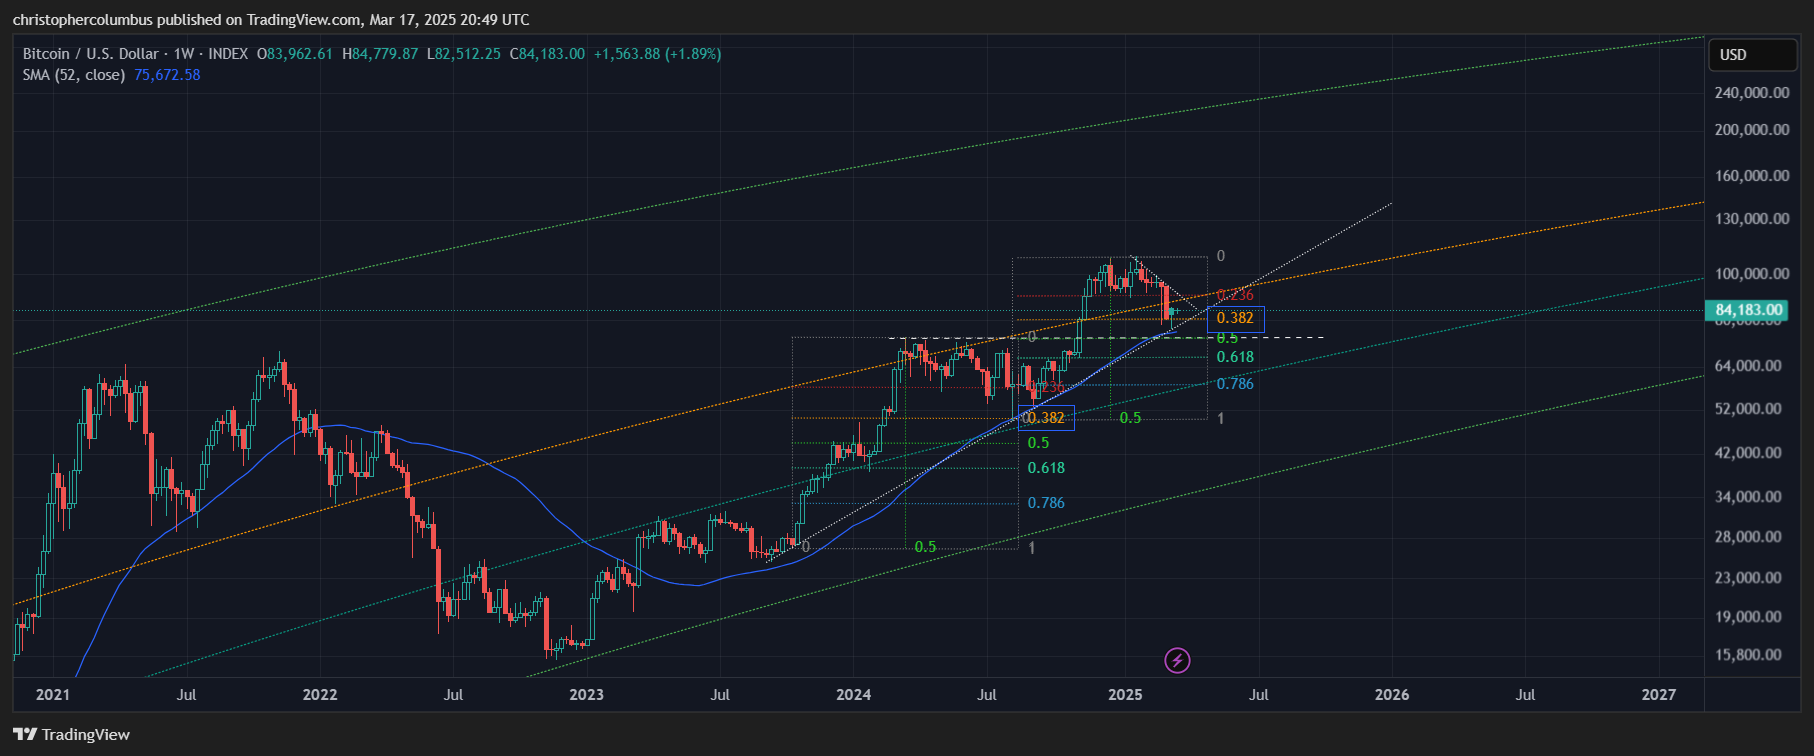
Currently price is at technical support:
- repeated 0.38 real Fibonacci retracement
- longer term diagonal support
- horizontal resistance come support
- 1 year moving average support
An interesting juncture. Can price push through to new highs in the second half of this year in the renewal of a heated market and in observance of the four year cycle, or will price come back to the ‘buy zone’. The default position has to be a continued bullish outlook until those technicals were broken.
Until next time,
Stay [relatively] safe out there,
Dave the Wave.